


Costs and Income of U.S. Swine Farms
This page shows the data about revenues and production costs of swine farms in the US..
The annual data are recorded by the United States Department of Agriculture (USDA).
The first chart shows the historical trend of revenues, divided by category.
The second chart compares the revenues total (blue curve) with the farm costs, grouped into two categories.
The third chart allows to analyze the individual cost items by clicking on the category names.
The charts show the weight of each individual items on the total costs. By clicking on the legend it is possible to hide "Other" to easily analyze the items with a lower impact on the total farm cost.
You can also display the data for other types of swine farm:
Swine Farm type: Generic Farm
Average costs and income of US farmers
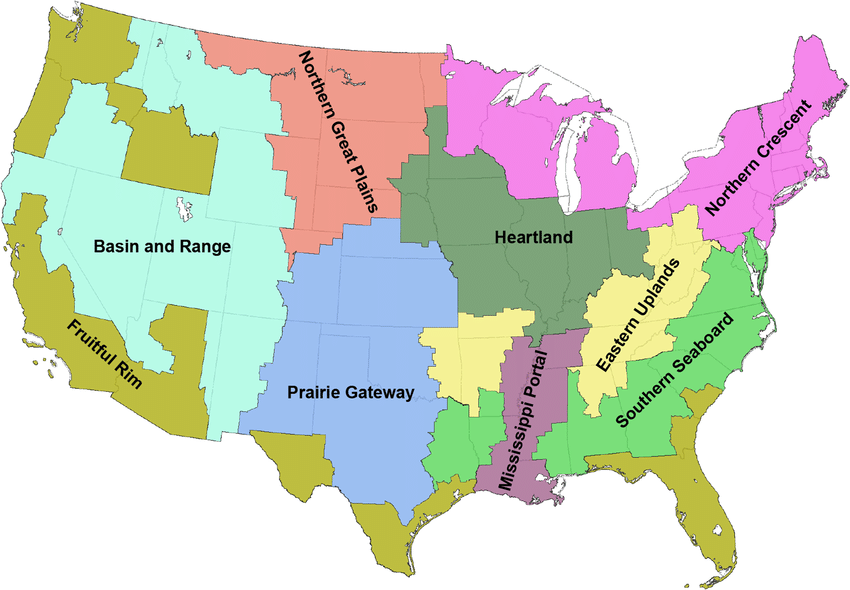
Data relating to: Northern Crescent
| Historical trend and comparison of costs and revenues of the last 10 years Northern_Crescent - Farm type: Generic Farm Source: USDA - Processed by: CLAL |
||||||||||
|---|---|---|---|---|---|---|---|---|---|---|
| Year | ||||||||||
| Returns ($/cwt) (€/kg) |
||||||||||
| Costs ($/cwt) (€/kg) |
||||||||||
| Margin ($/cwt) (€/kg) |
||||||||||