Aim
to provide the tools necessary to manage the cultural change towards sustainable production models.
The Water & Energy Project
provides agri-food operators with an updated picture of the problems concerning water and energy use, provides information and indications necessary in order to deal effectively and with full understanding with the many issues related to the responsible management of resources which are vital for the future of our planet.
Good Practices
focuses on how to enhance the value of products, farms and supply chains by focusing on examples of good practices and on environmental sustainability certifications.
Latteria Soresina
Thanks to the cultivation and maintenance of the agricultural areas under their control the farmers and members of the Latteria Soresina farm an area of about 1/4 of the agricultural soil of the province of Cremona, one of the Italian provinces most devoted to agriculture... read >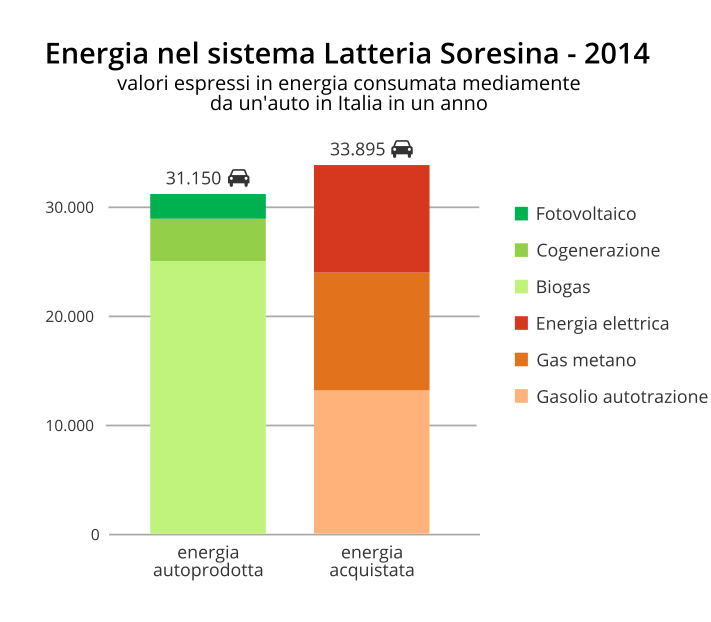
Lattebusche
Lattebusche has embarked on a path to sustainability. The care that this cooperative has for its territory is not limited to the important work of its associated producers, who are naturally inclined to the preservations of their own territory, it is also based on the investments, certifications and on the daily actions taken within its production plants... read >
Latteria Soresina
Maintenance of the territory and production of energy from renewable sources
Thanks to the cultivation and maintenance of the agricultural areas under their control the farmers and members of the Latteria Soresina farm an area of about 1/4 of the agricultural soil of the province of Cremona, one of the Italian provinces most devoted to agriculture... read >
Lattebusche
Indicators and results for sustainability
Lattebusche has embarked on a path to sustainability. The care that this cooperative has for its territory is not limited to the important work of its associated producers, who are naturally inclined to the preservations of their own territory, it is also based on the investments, certifications and on the daily actions taken within its production plants... read >Agricultural Market and Fertilizers
| IT, Milan: Italian soybeans price | Increased | 470 | €/ton |
| IT, Milan: Bran price | Increased | 129 | €/ton |
| IT, Milan: Italian Soybeans flour price | Increased | 490 | €/ton |
| IT, Milan: Italian higher common wheat price | Decreased | 267 | €/ton |
| IT, Milan: Foreign soybeans price | Increased | 468 | €/ton |
| IT, Foggia: durum wheat - mercantile price | Decreased | 352 | €/ton |
| IT, Foggia: durum wheat - buono mercantile price | Decreased | 352 | €/ton |
| IT, Foggia: durum wheat - fino price | Decreased | 363 | €/ton |
| IT, Bologna: Barley - s.w. 65 and over | Increased | 246 | €/ton |
| IT, Bologna: Barley - s.w. 62/64 price | Increased | 238 | €/ton |
| IT, Bologna: Sorghum - Italian white price | Decreased | 283 | €/ton |
| IT, Bologna: Corn - Italian for livestock (with characteristics) price | Decreased | 291 | €/ton |
| IT, Turin - Triple superphosphate 46% | In calo | 545 | €/ton |
| IT, Turin - Ammonium nitrate 26% | In calo | 315 | €/ton |
| IT, Turin - Urea 46% | In calo | 400 | €/ton |
| Simulated Feed Ration (vs prev month) | -1.03% |
| Milk:Feed Ratio | 1.68 |
- Market News evidences only the changes; should no price change or no quotation take place, any mention will be made.
- The change/variation concerning PRODUCTION/OUTPUT quantity refers to the same period of the previous year.
- The change/variation concerning STOCK quantity refers to the previous month.
- The change/variation of price refers to PRICES expressed in local currency (for both EU and the World). The change refers to the previous week/month/year, as the case may be. In the case of dual-listed (min and max), changes are calculated using the MAX PRICE.
Slaughtered cowsenter
Global Snapshot
 /Ton /Ton |
US (17-04-2024) |
Argentina (15-04-2024) |
ITALY (16-04-2024) |
|||||
| Product | Value | % Chg* | Value | % Chg* | Value | % Chg* | ||
| CORN | 161 | +0,0% | 165 | +2,5% | 212 | 0,0% | ||
| SOY | 416 | +0,6% | 271 | +1,0% | 469 | +1,1% | ||
| WHEAT | 190 1 | -2,6% | 204 | +6,5% | 264 | -0,4% | ||
|
* Change on the previous price quotation.
1) Prezzi riferiti a Hard Red Wheat |
||||||||
 /Ton
/TonMarket Balances:
Show the data of:
Previous season
Current season
| Previous forecast
| Current forecast
Show the data of:
Previous season
Current season
| Previous forecast
| Current forecast
Show the data of:
Previous season
Current season
| Previous forecast
| Current forecast
Show the data of:
Previous season
Current season
| Previous forecast
| Current forecast
Show the data of:
Previous season
Current season
| Previous forecast
| Current forecast
Show the data of:
Previous season
Current season
| Previous forecast
| Current forecast
Show the data of:
Previous season
Current season
| Previous forecast
| Current forecast
Show the data of:
Previous season
Current season
| Previous forecast
| Current forecast
Show the data of:
Previous season
Current season
| Previous forecast
| Current forecast
Show the data of:
Previous season
Current season
| Previous forecast
| Current forecast
|
Corn
| Balance sheet in Mio Tons
Year 2023-24 (Forecast April)
Corn US - Price
Decreasing |
||||||||||||
|---|---|---|---|---|---|---|---|---|---|---|---|---|
| Country | Beginning Stocks | Production | Import | Export | Consumption | Ending Stocks | ||||||
| World | 302.19 | -2.8% | 1227.86 | +6.1% | 187.47 | +8.5% | 200.59 | +11.3% | 1198.65 | +3.4% | 318.28 | +5.3% |
| United States | 34.55 | -1.2% | 389.69 | +12.4% | 0.64 | -35.4% | 53.34 | +26.4% | 317.64 | +3.8% | 53.90 | +56.0% |
| Share % | 11.4% | 31.7% | 0.3% | 26.6% | 26.5% | 16.9% | ||||||
| China | 206.04 | -1.5% | 288.84 | +4.2% | 23.00 | +22.9% | 0.02 | +150.0% | 306.00 | +2.3% | 211.86 | +2.8% |
| Share % | 68.2% | 23.5% | 12.3% | 0.0% | 25.5% | 66.6% | ||||||
| Brazil | 11.54 | +190.6% | 124.00 | -9.5% | 1.20 | -10.0% | 52.00 | -4.2% | 78.50 | +2.6% | 6.24 | -45.9% |
| Share % | 3.8% | 10.1% | 0.6% | 25.9% | 6.5% | 2.0% | ||||||
| EU-27 | 7.31 | -36.5% | 61.00 | +16.7% | 21.00 | -9.5% | 4.20 | 0.0% | 77.90 | +3.2% | 7.21 | -1.4% |
| Share % | 2.4% | 5.0% | 11.2% | 2.1% | 6.5% | 2.3% | ||||||
| Argentina | 1.17 | -34.7% | 55.00 | +52.8% | 0.02 | -6.3% | 42.00 | +66.4% | 13.10 | +14.9% | 1.09 | -7.2% |
| Share % | 0.4% | 4.5% | 0.0% | 20.9% | 1.1% | 0.3% | ||||||
| Source: USDA - WASDE, Last Update: 2024-04-12 | Visit the page with more detailed information | |||||||||||
| Corn - Balance sheet in Mio Tons | Year 2023-24 (Forecast Marzo) | ||||||||||||
|---|---|---|---|---|---|---|---|---|---|---|---|---|
| Country | Beginning Stocks | Production | Import | Export | Consumption | Ending Stocks | ||||||
| World | 301.62 | -3.0% | 1230.24 | +6.3% | 189.48 | +9.6% | 202.27 | +12.2% | 1199.45 | +3.5% | 319.63 | +5.8% |
| United States | 34.55 | -1.2% | 389.69 | +12.4% | 0.64 | -35.4% | 53.34 | +26.4% | 316.37 | +3.4% | 55.17 | +59.7% |
| Share % | 11.4% | 31.7% | 0.3% | 26.6% | 26.4% | 17.3% | ||||||
| China | 206.04 | -1.5% | 288.84 | +4.2% | 23.00 | +22.9% | 0.02 | +150.0% | 306.00 | +2.3% | 211.86 | +2.8% |
| Share % | 68.2% | 23.5% | 12.3% | 0.0% | 25.5% | 66.6% | ||||||
| Brazil | 11.47 | +188.9% | 124.00 | -9.5% | 1.20 | -10.0% | 52.00 | -4.2% | 78.50 | +2.6% | 6.17 | -46.5% |
| Share % | 3.8% | 10.1% | 0.6% | 25.9% | 6.5% | 1.9% | ||||||
| EU-27 | 7.23 | -37.1% | 60.10 | +14.9% | 22.00 | -5.2% | 4.20 | 0.0% | 77.90 | +3.2% | 7.23 | -1.1% |
| Share % | 2.4% | 4.9% | 11.7% | 2.1% | 6.5% | 2.3% | ||||||
| Argentina | 1.11 | -38.1% | 56.00 | +55.6% | 0.02 | -6.3% | 42.00 | +66.4% | 14.10 | +23.7% | 1.03 | -12.4% |
| Share % | 0.4% | 4.6% | 0.0% | 20.9% | 1.2% | 0.3% | ||||||
| Source: USDA, Last Update: 2024-04-12 | Visit the page with more detailed information | |||||||||||
| Corn - Balance sheet in Mio Tons | Year 2022-23 | ||||||||||||
|---|---|---|---|---|---|---|---|---|---|---|---|---|
| Country | Beginning Stocks | Production | Import | Export | Consumption | Ending Stocks | ||||||
| World | 310.79 | +6.1% | 1157.74 | -4.8% | 172.84 | -6.3% | 180.23 | -12.7% | 1158.95 | -1.5% | 302.19 | -2.8% |
| United States | 34.98 | +11.5% | 346.74 | -9.1% | 0.98 | +59.8% | 42.20 | -32.8% | 305.95 | -3.1% | 34.55 | -1.2% |
| Share % | 11.3% | 29.9% | 0.6% | 23.4% | 26.4% | 11.4% | ||||||
| China | 209.14 | +1.7% | 277.20 | +1.7% | 18.71 | -14.5% | 0.01 | +166.7% | 299.00 | +2.7% | 206.04 | -1.5% |
| Share % | 67.3% | 23.9% | 10.8% | 0.0% | 25.8% | 68.2% | ||||||
| Brazil | 3.97 | -4.4% | 137.00 | +18.1% | 1.33 | -48.7% | 54.26 | +12.4% | 76.50 | +8.5% | 11.54 | +190.6% |
| Share % | 1.3% | 11.8% | 0.8% | 30.1% | 6.6% | 3.8% | ||||||
| EU-27 | 11.51 | +47.0% | 52.29 | -27.0% | 23.21 | +17.6% | 4.20 | -30.3% | 75.50 | -7.6% | 7.31 | -36.5% |
| Share % | 3.7% | 4.5% | 13.4% | 2.3% | 6.5% | 2.4% | ||||||
| Argentina | 1.80 | +52.1% | 36.00 | -27.3% | 0.02 | +100.0% | 25.24 | -27.2% | 11.40 | -19.7% | 1.17 | -34.7% |
| Share % | 0.6% | 3.1% | 0.0% | 14.0% | 1.0% | 0.4% | ||||||
| Source: USDA, Last Update: 2024-04-12 | Visit the page with more detailed information | |||||||||||
|
Soybean
| Balance sheet in Mio Tons
Year 2023-24 (Forecast April)
Soybean US - Price
Decreasing |
||||||||||||
|---|---|---|---|---|---|---|---|---|---|---|---|---|
| Country | Beginning Stocks | Production | Import | Export | Consumption | Ending Stocks | ||||||
| World | 101.31 | +8.8% | 396.73 | +4.9% | 170.33 | +1.5% | 173.06 | +0.6% | 381.08 | +4.2% | 114.22 | +12.7% |
| Brazil | 37.35 | +35.3% | 155.00 | -4.3% | 0.45 | +192.2% | 103.00 | +7.8% | 56.75 | -0.3% | 33.05 | -11.5% |
| Share % | 36.9% | 39.1% | 0.3% | 59.5% | 14.9% | 28.9% | ||||||
| United States | 7.19 | -3.7% | 113.34 | -2.5% | 0.68 | +1.9% | 46.27 | -14.7% | 65.69 | +4.3% | 9.26 | +28.7% |
| Share % | 7.1% | 28.6% | 0.4% | 26.7% | 17.2% | 8.1% | ||||||
| Argentina | 17.21 | -28.0% | 50.00 | +100.0% | 6.10 | -32.7% | 4.60 | +9.9% | 42.75 | +16.9% | 25.96 | +50.8% |
| Share % | 17.0% | 12.6% | 3.6% | 2.7% | 11.2% | 22.7% | ||||||
| China | 32.34 | +28.6% | 20.84 | +2.7% | 105.00 | +0.5% | 0.10 | +11.1% | 120.50 | +2.6% | 37.58 | +16.2% |
| Share % | 31.9% | 5.3% | 61.6% | 0.1% | 31.6% | 32.9% | ||||||
| India | 1.58 | +6.1% | 11.00 | -11.4% | 0.50 | -28.8% | 0.05 | +127.3% | 12.33 | -5.2% | 0.71 | -55.2% |
| Share % | 1.6% | 2.8% | 0.3% | 0.0% | 3.2% | 0.6% | ||||||
| Source: USDA - WASDE, Last Update: 2024-04-12 | Visit the page with more detailed information | |||||||||||
| Soybean - Balance sheet in Mio Tons | Year 2023-24 (Forecast Marzo) | ||||||||||||
|---|---|---|---|---|---|---|---|---|---|---|---|---|
| Country | Beginning Stocks | Production | Import | Export | Consumption | Ending Stocks | ||||||
| World | 102.15 | +9.7% | 396.85 | +4.9% | 170.78 | +1.7% | 173.61 | +0.9% | 381.90 | +4.4% | 114.27 | +12.8% |
| Brazil | 37.35 | +35.3% | 155.00 | -4.3% | 0.45 | +192.2% | 103.00 | +7.8% | 56.75 | -0.3% | 33.05 | -11.5% |
| Share % | 36.9% | 39.1% | 0.3% | 59.5% | 14.9% | 28.9% | ||||||
| United States | 7.19 | -3.7% | 113.34 | -2.5% | 0.82 | +22.3% | 46.81 | -13.6% | 65.97 | +4.8% | 8.57 | +19.2% |
| Share % | 7.1% | 28.6% | 0.5% | 27.0% | 17.3% | 7.5% | ||||||
| Argentina | 17.21 | -28.0% | 50.00 | +100.0% | 6.10 | -32.7% | 4.60 | +9.9% | 42.75 | +16.9% | 25.96 | +50.8% |
| Share % | 17.0% | 12.6% | 3.6% | 2.7% | 11.2% | 22.7% | ||||||
| China | 32.34 | +28.6% | 20.84 | +2.7% | 105.00 | +0.5% | 0.10 | +11.1% | 120.50 | +2.6% | 37.58 | +16.2% |
| Share % | 31.9% | 5.3% | 61.6% | 0.1% | 31.6% | 32.9% | ||||||
| India | 1.58 | +6.1% | 11.00 | -11.4% | 0.50 | -28.8% | 0.05 | +127.3% | 12.48 | -4.0% | 0.56 | -64.7% |
| Share % | 1.6% | 2.8% | 0.3% | 0.0% | 3.3% | 0.5% | ||||||
| Source: USDA, Last Update: 2024-04-12 | Visit the page with more detailed information | |||||||||||
| Soybean - Balance sheet in Mio Tons | Year 2022-23 | ||||||||||||
|---|---|---|---|---|---|---|---|---|---|---|---|---|
| Country | Beginning Stocks | Production | Import | Export | Consumption | Ending Stocks | ||||||
| World | 93.09 | -5.6% | 378.20 | +4.9% | 167.87 | +8.7% | 172.09 | +11.4% | 365.76 | -0.1% | 101.31 | +8.8% |
| Brazil | 27.60 | -6.7% | 162.00 | +24.1% | 0.15 | -71.4% | 95.51 | +20.8% | 56.90 | +5.4% | 37.35 | +35.3% |
| Share % | 29.6% | 42.8% | 0.1% | 55.5% | 15.6% | 36.9% | ||||||
| United States | 7.47 | +6.8% | 116.22 | -4.3% | 0.67 | +54.0% | 54.21 | -7.4% | 62.96 | +0.1% | 7.19 | -3.7% |
| Share % | 8.0% | 30.7% | 0.4% | 31.5% | 17.2% | 7.1% | ||||||
| Argentina | 23.90 | -4.6% | 25.00 | -43.1% | 9.06 | +136.0% | 4.19 | +46.3% | 36.57 | -20.6% | 17.21 | -28.0% |
| Share % | 25.7% | 6.6% | 5.4% | 2.4% | 10.0% | 17.0% | ||||||
| China | 25.15 | -12.9% | 20.28 | +23.7% | 104.50 | +15.7% | 0.09 | -11.8% | 117.50 | +6.5% | 32.34 | +28.6% |
| Share % | 27.0% | 5.4% | 62.3% | 0.1% | 32.1% | 31.9% | ||||||
| India | 1.49 | > +1000% | 12.41 | +4.4% | 0.70 | +26.5% | 0.02 | -63.9% | 13.00 | +18.1% | 1.58 | +6.1% |
| Share % | 1.6% | 3.3% | 0.4% | 0.0% | 3.6% | 1.6% | ||||||
| Source: USDA, Last Update: 2024-04-12 | Visit the page with more detailed information | |||||||||||
|
Wheat
| Balance sheet in Mio Tons
Year 2023-24 (Forecast April)
Wheat US - Price
Decreasing |
||||||||||||
|---|---|---|---|---|---|---|---|---|---|---|---|---|
| Country | Beginning Stocks | Production | Import | Export | Consumption | Ending Stocks | ||||||
| World | 271.00 | -0.6% | 787.36 | -0.2% | 212.34 | +0.2% | 213.47 | -3.0% | 798.97 | +2.1% | 258.27 | -4.7% |
| China | 138.82 | +1.5% | 136.59 | -0.8% | 11.00 | -17.2% | 0.90 | -4.9% | 153.50 | +3.7% | 132.01 | -4.9% |
| Share % | 51.2% | 17.3% | 5.2% | 0.4% | 19.2% | 51.1% | ||||||
| EU-27 | 16.04 | +17.7% | 134.15 | -0.1% | 13.50 | +10.7% | 34.50 | -1.7% | 112.50 | +3.2% | 16.69 | +4.1% |
| Share % | 5.9% | 17.0% | 6.4% | 16.2% | 14.1% | 6.5% | ||||||
| India | 9.50 | -51.3% | 110.55 | +6.3% | 0.12 | +126.4% | 0.30 | -94.4% | 112.97 | +4.0% | 6.90 | -27.4% |
| Share % | 3.5% | 14.0% | 0.1% | 0.1% | 14.1% | 2.7% | ||||||
| Russia | 14.64 | +21.1% | 91.50 | -0.5% | 0.30 | 0.0% | 52.00 | +9.5% | 42.00 | -0.6% | 12.44 | -15.0% |
| Share % | 5.4% | 11.6% | 0.1% | 24.4% | 5.3% | 4.8% | ||||||
| United States | 15.50 | -15.5% | 49.31 | +9.8% | 3.81 | +14.9% | 19.32 | -6.4% | 30.32 | -0.3% | 18.98 | +22.5% |
| Share % | 5.7% | 6.3% | 1.8% | 9.1% | 3.8% | 7.3% | ||||||
| Source: USDA - WASDE, Last Update: 2024-04-12 | Visit the page with more detailed information | |||||||||||
| Wheat - Balance sheet in Mio Tons | Year 2023-24 (Forecast Marzo) | ||||||||||||
|---|---|---|---|---|---|---|---|---|---|---|---|---|
| Country | Beginning Stocks | Production | Import | Export | Consumption | Ending Stocks | ||||||
| World | 271.10 | -0.6% | 786.70 | -0.3% | 211.21 | -0.4% | 212.13 | -3.7% | 798.05 | +1.9% | 258.83 | -4.5% |
| China | 138.82 | +1.5% | 136.59 | -0.8% | 11.00 | -17.2% | 0.90 | -4.9% | 153.50 | +3.7% | 132.01 | -4.9% |
| Share % | 51.2% | 17.3% | 5.2% | 0.4% | 19.2% | 51.1% | ||||||
| EU-27 | 16.52 | +21.2% | 133.65 | -0.5% | 13.00 | +6.6% | 36.50 | +4.1% | 111.50 | +2.3% | 15.17 | -5.4% |
| Share % | 6.1% | 17.0% | 6.1% | 17.1% | 14.0% | 5.9% | ||||||
| India | 9.50 | -51.3% | 110.55 | +6.3% | 0.25 | +371.7% | 0.30 | -94.4% | 111.00 | +2.1% | 9.00 | -5.3% |
| Share % | 3.5% | 14.0% | 0.1% | 0.1% | 13.9% | 3.5% | ||||||
| Russia | 14.64 | +21.1% | 91.50 | -0.5% | 0.30 | 0.0% | 51.00 | +7.4% | 43.00 | +1.8% | 12.44 | -15.0% |
| Share % | 5.4% | 11.6% | 0.1% | 23.9% | 5.4% | 4.8% | ||||||
| United States | 15.50 | -15.5% | 49.31 | +9.8% | 3.95 | +19.0% | 19.32 | -6.4% | 31.13 | +2.3% | 18.30 | +18.1% |
| Share % | 5.7% | 6.3% | 1.9% | 9.1% | 3.9% | 7.1% | ||||||
| Source: USDA, Last Update: 2024-04-12 | Visit the page with more detailed information | |||||||||||
| Wheat - Balance sheet in Mio Tons | Year 2022-23 | ||||||||||||
|---|---|---|---|---|---|---|---|---|---|---|---|---|
| Country | Beginning Stocks | Production | Import | Export | Consumption | Ending Stocks | ||||||
| World | 272.69 | -3.9% | 789.34 | +1.2% | 211.96 | +5.9% | 220.17 | +8.6% | 782.81 | -0.8% | 271.00 | -0.6% |
| China | 136.76 | -1.7% | 137.72 | +0.6% | 13.28 | +38.8% | 0.95 | +8.1% | 148.00 | 0.0% | 138.82 | +1.5% |
| Share % | 50.2% | 17.4% | 6.3% | 0.4% | 18.9% | 51.2% | ||||||
| EU-27 | 13.63 | +27.4% | 134.29 | -3.0% | 12.19 | +163.3% | 35.08 | +9.9% | 109.00 | +0.7% | 16.04 | +17.7% |
| Share % | 5.0% | 17.0% | 5.8% | 15.9% | 13.9% | 5.9% | ||||||
| India | 19.50 | -29.9% | 104.00 | -5.1% | 0.05 | +82.8% | 5.38 | -33.1% | 108.68 | -1.1% | 9.50 | -51.3% |
| Share % | 7.2% | 13.2% | 0.0% | 2.4% | 13.9% | 3.5% | ||||||
| Russia | 12.09 | +6.2% | 92.00 | +22.4% | 0.30 | 0.0% | 47.50 | +43.9% | 42.25 | +1.2% | 14.64 | +21.1% |
| Share % | 4.4% | 11.7% | 0.1% | 21.6% | 5.4% | 5.4% | ||||||
| United States | 18.36 | -20.2% | 44.90 | +0.2% | 3.32 | +26.7% | 20.65 | -4.7% | 30.42 | +0.0% | 15.50 | -15.5% |
| Share % | 6.7% | 5.7% | 1.6% | 9.4% | 3.9% | 5.7% | ||||||
| Source: USDA, Last Update: 2024-04-12 | Visit the page with more detailed information | |||||||||||
|
Barley
| Balance sheet in Mio Tons
Year 2023-24 (Forecast April)
Barley US - Price
Decreasing |
||||||||||||
|---|---|---|---|---|---|---|---|---|---|---|---|---|
| Country | Beginning Stocks | Production | Import | Export | Consumption | Ending Stocks | ||||||
| World | 20.43 | +10.2% | 142.26 | -4.9% | 28.44 | -8.9% | 28.34 | -7.2% | 144.41 | -2.7% | 18.39 | -10.0% |
| EU-27 | 5.70 | +7.8% | 47.70 | -7.9% | 1.80 | -8.9% | 6.00 | -10.0% | 44.10 | -5.6% | 5.10 | -10.5% |
| Share % | 27.9% | 33.5% | 6.3% | 21.2% | 30.5% | 27.7% | ||||||
| Russia | 1.06 | +49.2% | 20.50 | -4.7% | 0.05 | 0.0% | 5.80 | +28.9% | 15.10 | -9.6% | 0.71 | -33.0% |
| Share % | 5.2% | 14.4% | 0.2% | 20.5% | 10.5% | 3.9% | ||||||
| Australia | 3.22 | +13.1% | 10.80 | -23.6% | 0.00 | 0.0% | 6.20 | -20.2% | 6.00 | 0.0% | 1.82 | -43.5% |
| Share % | 15.8% | 7.6% | 0.0% | 21.9% | 4.2% | 9.9% | ||||||
| Canada | 0.71 | +30.6% | 8.90 | -10.9% | 0.06 | +130.8% | 2.30 | -26.9% | 6.70 | +0.0% | 0.67 | -6.2% |
| Share % | 3.5% | 6.3% | 0.2% | 8.1% | 4.6% | 3.6% | ||||||
| Turkey | 0.73 | +131.6% | 8.00 | +8.1% | 0.40 | -81.3% | 0.15 | -33.3% | 8.50 | -4.5% | 0.48 | -34.2% |
| Share % | 3.6% | 5.6% | 1.4% | 0.5% | 5.9% | 2.6% | ||||||
| Source: USDA - WASDE, Last Update: 2024-04-12 | Visit the page with more detailed information | |||||||||||
| Barley - Balance sheet in Mio Tons | Year 2023-24 (Forecast Marzo) | ||||||||||||
|---|---|---|---|---|---|---|---|---|---|---|---|---|
| Country | Beginning Stocks | Production | Import | Export | Consumption | Ending Stocks | ||||||
| World | 20.07 | +8.3% | 142.22 | -4.9% | 28.06 | -10.1% | 28.51 | -6.7% | 143.30 | -3.4% | 18.54 | -9.2% |
| EU-27 | 5.54 | +4.8% | 47.50 | -8.3% | 1.80 | -8.9% | 6.20 | -7.0% | 43.60 | -6.6% | 5.04 | -11.5% |
| Share % | 27.1% | 33.4% | 6.3% | 21.9% | 30.2% | 27.4% | ||||||
| Russia | 1.06 | +49.2% | 20.50 | -4.7% | 0.05 | 0.0% | 5.80 | +28.9% | 15.10 | -9.6% | 0.71 | -33.0% |
| Share % | 5.2% | 14.4% | 0.2% | 20.5% | 10.5% | 3.9% | ||||||
| Australia | 3.22 | +13.1% | 10.80 | -23.6% | 0.00 | 0.0% | 6.20 | -20.2% | 6.00 | 0.0% | 1.82 | -43.5% |
| Share % | 15.8% | 7.6% | 0.0% | 21.9% | 4.2% | 9.9% | ||||||
| Canada | 0.71 | +30.6% | 8.90 | -10.9% | 0.06 | +130.8% | 2.30 | -26.9% | 6.70 | +0.0% | 0.67 | -6.2% |
| Share % | 3.5% | 6.3% | 0.2% | 8.1% | 4.6% | 3.6% | ||||||
| Turkey | 0.73 | +131.6% | 8.00 | +8.1% | 0.40 | -81.3% | 0.15 | -33.3% | 8.50 | -4.5% | 0.48 | -34.2% |
| Share % | 3.6% | 5.6% | 1.4% | 0.5% | 5.9% | 2.6% | ||||||
| Source: USDA, Last Update: 2024-04-12 | Visit the page with more detailed information | |||||||||||
| Barley - Balance sheet in Mio Tons | Year 2022-23 | ||||||||||||
|---|---|---|---|---|---|---|---|---|---|---|---|---|
| Country | Beginning Stocks | Production | Import | Export | Consumption | Ending Stocks | ||||||
| World | 18.54 | -13.5% | 149.57 | +3.0% | 31.21 | +3.7% | 30.55 | -5.5% | 148.34 | +1.7% | 20.43 | +10.2% |
| EU-27 | 5.29 | +5.5% | 51.80 | -0.5% | 1.98 | +99.0% | 6.67 | -9.1% | 46.70 | +2.8% | 5.70 | +7.8% |
| Share % | 28.5% | 34.6% | 6.3% | 21.8% | 31.5% | 27.9% | ||||||
| Russia | 0.71 | -5.9% | 21.50 | +22.8% | 0.05 | 0.0% | 4.50 | +36.4% | 16.70 | +16.8% | 1.06 | +49.2% |
| Share % | 3.8% | 14.4% | 0.2% | 14.7% | 11.3% | 5.2% | ||||||
| Australia | 2.85 | +13.1% | 14.14 | -1.4% | 0.00 | 0.0% | 7.77 | -3.0% | 6.00 | 0.0% | 3.22 | +13.1% |
| Share % | 15.4% | 9.5% | 0.0% | 25.4% | 4.0% | 15.8% | ||||||
| Canada | 0.54 | -23.6% | 9.99 | +43.0% | 0.03 | -88.6% | 3.15 | +58.9% | 6.70 | +24.1% | 0.71 | +30.6% |
| Share % | 2.9% | 6.7% | 0.1% | 10.3% | 4.5% | 3.5% | ||||||
| Turkey | 0.32 | -39.5% | 7.40 | +64.4% | 2.14 | -25.3% | 0.23 | +30.1% | 8.90 | +20.3% | 0.73 | +131.6% |
| Share % | 1.7% | 4.9% | 6.9% | 0.8% | 6.0% | 3.6% | ||||||
| Source: USDA, Last Update: 2024-04-12 | Visit the page with more detailed information | |||||||||||
| Sunflowerseed - Balance sheet in Mio Tons | Year 2023-24 (Forecast April) | ||||||||||||
|---|---|---|---|---|---|---|---|---|---|---|---|---|
| Country | Beginning Stocks | Production | Import | Export | Consumption | Ending Stocks | ||||||
| World | 4.15 | -47.1% | 54.80 | +3.9% | 2.72 | -27.9% | 2.81 | -30.2% | 56.13 | -0.2% | 2.74 | -34.0% |
| Russia | 0.91 | -10.9% | 17.10 | +5.2% | 0.05 | -33.3% | 0.45 | +73.1% | 16.98 | +4.9% | 0.63 | -30.9% |
| Share % | 21.9% | 31.2% | 1.8% | 16.0% | 30.3% | 23.0% | ||||||
| Ukraine | 0.85 | -81.8% | 14.50 | +18.9% | 0.03 | -3.2% | 0.33 | -82.5% | 14.88 | +4.9% | 0.18 | -79.3% |
| Share % | 20.5% | 26.5% | 1.1% | 11.7% | 26.5% | 6.6% | ||||||
| EU-27 | 0.41 | -41.2% | 10.00 | +6.6% | 0.70 | -52.1% | 0.45 | -24.4% | 10.24 | -2.8% | 0.42 | +3.7% |
| Share % | 9.9% | 18.2% | 25.7% | 16.0% | 18.2% | 15.3% | ||||||
| Argentina | 1.08 | +52.7% | 4.10 | -18.3% | 0.00 | -100.0% | 0.18 | +87.5% | 4.23 | -7.1% | 0.78 | -28.1% |
| Share % | 26.0% | 7.5% | 0.0% | 6.4% | 7.5% | 28.5% | ||||||
| China | 0.20 | -21.4% | 1.70 | -2.4% | 0.30 | +12.8% | 0.42 | +10.5% | 1.58 | -6.0% | 0.20 | 0.0% |
| Share % | 4.8% | 3.1% | 11.0% | 14.9% | 2.8% | 7.3% | ||||||
| Source: USDA - WASDE, Last Update: 2024-04-12 | Visit the page with more detailed information | |||||||||||
| Sunflowerseed - Balance sheet in Mio Tons | Year 2023-24 (Forecast Marzo) | ||||||||||||
|---|---|---|---|---|---|---|---|---|---|---|---|---|
| Country | Beginning Stocks | Production | Import | Export | Consumption | Ending Stocks | ||||||
| World | 3.82 | -51.3% | 54.91 | +4.1% | 3.00 | -20.7% | 2.77 | -31.1% | 55.93 | -0.5% | 3.03 | -27.1% |
| Russia | 0.91 | -10.9% | 17.10 | +5.2% | 0.05 | -33.3% | 0.45 | +73.1% | 16.98 | +4.9% | 0.63 | -30.9% |
| Share % | 21.9% | 31.2% | 1.8% | 16.0% | 30.3% | 23.0% | ||||||
| Ukraine | 0.82 | -82.5% | 14.50 | +18.9% | 0.03 | -3.2% | 0.40 | -78.4% | 14.48 | +2.1% | 0.47 | -44.4% |
| Share % | 19.8% | 26.5% | 1.1% | 14.2% | 25.8% | 17.2% | ||||||
| EU-27 | 0.21 | -69.2% | 10.20 | +8.7% | 0.60 | -58.9% | 0.45 | -24.4% | 10.13 | -3.9% | 0.44 | +7.6% |
| Share % | 5.1% | 18.6% | 22.1% | 16.0% | 18.0% | 16.1% | ||||||
| Argentina | 1.08 | +52.7% | 4.10 | -18.3% | 0.00 | -100.0% | 0.15 | +56.3% | 4.25 | -6.6% | 0.78 | -27.7% |
| Share % | 26.0% | 7.5% | 0.0% | 5.3% | 7.6% | 28.5% | ||||||
| China | 0.20 | -21.4% | 1.70 | -2.4% | 0.30 | +12.8% | 0.42 | +10.5% | 1.58 | -6.0% | 0.20 | 0.0% |
| Share % | 4.8% | 3.1% | 11.0% | 14.9% | 2.8% | 7.3% | ||||||
| Source: USDA, Last Update: 2024-04-12 | Visit the page with more detailed information | |||||||||||
| Sunflowerseed - Balance sheet in Mio Tons | Year 2022-23 | ||||||||||||
|---|---|---|---|---|---|---|---|---|---|---|---|---|
| Country | Beginning Stocks | Production | Import | Export | Consumption | Ending Stocks | ||||||
| World | 7.84 | +225.4% | 52.77 | -7.2% | 3.78 | -1.4% | 4.02 | +1.9% | 56.22 | +9.6% | 4.15 | -47.1% |
| Russia | 1.02 | +960.4% | 16.25 | +4.4% | 0.08 | 0.0% | 0.26 | -5.5% | 16.18 | +12.0% | 0.91 | -10.9% |
| Share % | 13.0% | 30.8% | 2.1% | 6.5% | 28.8% | 21.9% | ||||||
| Ukraine | 4.65 | > +1000% | 12.20 | -30.3% | 0.03 | +47.6% | 1.86 | +14.4% | 14.18 | +24.9% | 0.85 | -81.8% |
| Share % | 59.3% | 23.1% | 0.8% | 46.3% | 25.2% | 20.5% | ||||||
| EU-27 | 0.69 | +72.6% | 9.39 | -9.1% | 1.46 | -18.7% | 0.60 | +49.9% | 10.54 | -7.9% | 0.41 | -41.2% |
| Share % | 8.8% | 17.8% | 38.6% | 14.9% | 18.7% | 9.9% | ||||||
| Argentina | 0.71 | +5.8% | 5.02 | +23.9% | 0.00 | +∞ | 0.10 | -40.4% | 4.55 | +18.2% | 1.08 | +52.7% |
| Share % | 9.1% | 9.5% | 0.0% | 2.5% | 8.1% | 26.0% | ||||||
| China | 0.25 | -60.3% | 1.74 | -19.2% | 0.27 | +69.4% | 0.38 | -13.2% | 1.68 | -25.3% | 0.20 | -21.4% |
| Share % | 3.2% | 3.3% | 7.1% | 9.5% | 3.0% | 4.8% | ||||||
| Source: USDA, Last Update: 2024-04-12 | Visit the page with more detailed information | |||||||||||
| Rapeseed - Balance sheet in Mio Tons | Year 2023-24 (Forecast April) | ||||||||||||
|---|---|---|---|---|---|---|---|---|---|---|---|---|
| Country | Beginning Stocks | Production | Import | Export | Consumption | Ending Stocks | ||||||
| World | 8.43 | +91.2% | 88.39 | -0.5% | 16.36 | -18.4% | 17.32 | -12.5% | 88.03 | +3.5% | 7.82 | -7.2% |
| EU-27 | 1.82 | +137.5% | 20.00 | +2.0% | 5.50 | -19.6% | 0.55 | +0.2% | 25.05 | +0.8% | 1.72 | -5.5% |
| Share % | 21.6% | 22.6% | 33.6% | 3.2% | 28.5% | 22.0% | ||||||
| Canada | 1.51 | +13.4% | 18.80 | +0.6% | 0.30 | +98.7% | 7.25 | -8.8% | 11.78 | +9.9% | 1.58 | +5.0% |
| Share % | 17.9% | 21.3% | 1.8% | 41.9% | 13.4% | 20.2% | ||||||
| China | 2.61 | +200.6% | 15.40 | -0.8% | 3.40 | -36.3% | 0.00 | 0.0% | 19.33 | +1.0% | 2.08 | -20.1% |
| Share % | 31.0% | 17.4% | 20.8% | 0.0% | 22.0% | 26.6% | ||||||
| India | 0.42 | -19.3% | 12.50 | +10.6% | 0.00 | 0.0% | 0.00 | 0.0% | 12.25 | +7.4% | 0.67 | +60.9% |
| Share % | 5.0% | 14.1% | 0.0% | 0.0% | 13.9% | 8.6% | ||||||
| Australia | 1.17 | +908.6% | 5.70 | -31.1% | 0.00 | -50.0% | 4.60 | -21.6% | 1.35 | 0.0% | 0.92 | -21.3% |
| Share % | 13.9% | 6.4% | 0.0% | 26.6% | 1.5% | 11.8% | ||||||
| Source: USDA - WASDE, Last Update: 2024-04-12 | Visit the page with more detailed information | |||||||||||
| Rapeseed - Balance sheet in Mio Tons | Year 2023-24 (Forecast Marzo) | ||||||||||||
|---|---|---|---|---|---|---|---|---|---|---|---|---|
| Country | Beginning Stocks | Production | Import | Export | Consumption | Ending Stocks | ||||||
| World | 8.71 | +97.6% | 88.07 | -0.9% | 16.06 | -19.9% | 17.07 | -13.7% | 87.70 | +3.1% | 8.07 | -4.3% |
| EU-27 | 1.83 | +139.0% | 20.00 | +2.0% | 5.30 | -22.5% | 0.40 | -27.1% | 25.20 | +1.4% | 1.53 | -15.9% |
| Share % | 21.7% | 22.6% | 32.4% | 2.3% | 28.6% | 19.6% | ||||||
| Canada | 1.51 | +13.4% | 18.80 | +0.6% | 0.25 | +65.6% | 7.55 | -5.0% | 11.43 | +6.6% | 1.58 | +5.0% |
| Share % | 17.9% | 21.3% | 1.5% | 43.6% | 13.0% | 20.2% | ||||||
| China | 2.61 | +200.6% | 15.40 | -0.8% | 3.40 | -36.3% | 0.00 | 0.0% | 19.33 | +1.0% | 2.08 | -20.1% |
| Share % | 31.0% | 17.4% | 20.8% | 0.0% | 22.0% | 26.6% | ||||||
| India | 0.42 | -19.3% | 12.50 | +10.6% | 0.00 | 0.0% | 0.00 | 0.0% | 12.25 | +7.4% | 0.67 | +60.9% |
| Share % | 5.0% | 14.1% | 0.0% | 0.0% | 13.9% | 8.6% | ||||||
| Australia | 1.17 | +908.6% | 5.50 | -33.5% | 0.00 | -50.0% | 4.40 | -25.1% | 1.33 | -1.9% | 0.95 | -19.1% |
| Share % | 13.9% | 6.2% | 0.0% | 25.4% | 1.5% | 12.1% | ||||||
| Source: USDA, Last Update: 2024-04-12 | Visit the page with more detailed information | |||||||||||
| Rapeseed - Balance sheet in Mio Tons | Year 2022-23 | ||||||||||||
|---|---|---|---|---|---|---|---|---|---|---|---|---|
| Country | Beginning Stocks | Production | Import | Export | Consumption | Ending Stocks | ||||||
| World | 4.41 | -27.0% | 88.83 | +17.2% | 20.04 | +44.0% | 19.78 | +28.9% | 85.07 | +11.9% | 8.43 | +91.2% |
| EU-27 | 0.77 | +14.8% | 19.61 | +13.0% | 6.84 | +22.8% | 0.55 | +21.5% | 24.85 | +11.1% | 1.82 | +137.5% |
| Share % | 17.5% | 22.1% | 34.1% | 2.8% | 29.2% | 21.6% | ||||||
| Canada | 1.33 | -25.2% | 18.70 | +31.2% | 0.15 | +43.8% | 7.95 | +51.6% | 10.72 | +12.2% | 1.51 | +13.4% |
| Share % | 30.2% | 21.1% | 0.7% | 40.2% | 12.6% | 17.9% | ||||||
| China | 0.87 | -43.0% | 15.53 | +5.6% | 5.34 | +222.0% | 0.00 | 0.0% | 19.13 | +12.3% | 2.61 | +200.6% |
| Share % | 19.7% | 17.5% | 26.6% | 0.0% | 22.5% | 31.0% | ||||||
| India | 0.52 | +40.7% | 11.30 | +1.8% | 0.00 | 0.0% | 0.00 | 0.0% | 11.40 | +4.1% | 0.42 | -19.3% |
| Share % | 11.8% | 12.7% | 0.0% | 0.0% | 13.4% | 5.0% | ||||||
| Australia | 0.12 | -69.0% | 8.27 | +21.3% | 0.00 | 0.0% | 5.87 | -0.6% | 1.35 | +14.9% | 1.17 | +908.6% |
| Share % | 2.7% | 9.3% | 0.0% | 29.7% | 1.6% | 13.9% | ||||||
| Source: USDA, Last Update: 2024-04-12 | Visit the page with more detailed information | |||||||||||
|
Rice
| Balance sheet in Mio Tons
Year 2023-24 (Forecast April)
Rice US - Price
Decreasing |
||||||||||||
|---|---|---|---|---|---|---|---|---|---|---|---|---|
| Country | Beginning Stocks | Production | Import | Export | Consumption | Ending Stocks | ||||||
| World | 177.97 | -2.8% | 515.53 | +0.2% | 50.30 | -9.6% | 52.94 | -2.1% | 518.71 | -0.5% | 172.15 | -3.3% |
| China | 106.60 | -5.7% | 144.62 | -0.9% | 1.70 | -61.2% | 1.70 | -2.1% | 148.22 | -4.4% | 103.00 | -3.4% |
| Share % | 59.9% | 28.1% | 3.4% | 3.2% | 28.6% | 59.8% | ||||||
| India | 35.00 | +2.9% | 134.00 | -1.3% | 0.00 | 0.0% | 16.00 | -21.0% | 118.00 | +3.0% | 35.00 | 0.0% |
| Share % | 19.7% | 26.0% | 0.0% | 30.2% | 22.7% | 20.3% | ||||||
| Bangladesh | 2.21 | +5.7% | 37.00 | +1.8% | 0.10 | -92.2% | 0.01 | +100.0% | 37.60 | +0.3% | 1.70 | -23.1% |
| Share % | 1.2% | 7.2% | 0.2% | 0.0% | 7.2% | 1.0% | ||||||
| Indonesia | 4.70 | +62.1% | 33.02 | -2.6% | 3.50 | 0.0% | 0.00 | 0.0% | 36.00 | +1.1% | 5.22 | +11.1% |
| Share % | 2.6% | 6.4% | 7.0% | 0.0% | 6.9% | 3.0% | ||||||
| Vietnam | 1.77 | -33.3% | 27.00 | +0.2% | 2.30 | +27.8% | 8.00 | -2.7% | 21.20 | -0.9% | 1.87 | +5.6% |
| Share % | 1.0% | 5.2% | 4.6% | 15.1% | 4.1% | 1.1% | ||||||
| Source: USDA - WASDE, Last Update: 2024-04-12 | Visit the page with more detailed information | |||||||||||
| Rice - Balance sheet in Mio Tons | Year 2023-24 (Forecast Marzo) | ||||||||||||
|---|---|---|---|---|---|---|---|---|---|---|---|---|
| Country | Beginning Stocks | Production | Import | Export | Consumption | Ending Stocks | ||||||
| World | 177.18 | -3.3% | 515.39 | +0.2% | 50.07 | -10.1% | 52.58 | -2.8% | 520.35 | -0.2% | 169.70 | -4.6% |
| China | 106.60 | -5.7% | 144.62 | -0.9% | 2.10 | -52.1% | 2.00 | +15.2% | 149.92 | -3.3% | 101.40 | -4.9% |
| Share % | 59.9% | 28.1% | 4.2% | 3.8% | 28.9% | 58.9% | ||||||
| India | 35.00 | +2.9% | 134.00 | -1.3% | 0.00 | 0.0% | 16.00 | -21.0% | 118.00 | +3.0% | 35.00 | 0.0% |
| Share % | 19.7% | 26.0% | 0.0% | 30.2% | 22.7% | 20.3% | ||||||
| Bangladesh | 2.21 | +5.7% | 36.30 | -0.1% | 0.50 | -60.8% | 0.01 | +100.0% | 37.60 | +0.3% | 1.40 | -36.6% |
| Share % | 1.2% | 7.0% | 1.0% | 0.0% | 7.2% | 0.8% | ||||||
| Indonesia | 4.70 | +62.1% | 33.50 | -1.2% | 3.50 | 0.0% | 0.00 | 0.0% | 36.10 | +1.4% | 5.60 | +19.1% |
| Share % | 2.6% | 6.5% | 7.0% | 0.0% | 7.0% | 3.3% | ||||||
| Vietnam | 1.77 | -33.3% | 27.00 | +0.2% | 1.60 | -11.1% | 7.80 | -5.2% | 21.20 | -0.9% | 1.37 | -22.6% |
| Share % | 1.0% | 5.2% | 3.2% | 14.7% | 4.1% | 0.8% | ||||||
| Source: USDA, Last Update: 2024-04-12 | Visit the page with more detailed information | |||||||||||
| Rice - Balance sheet in Mio Tons | Year 2022-23 | ||||||||||||
|---|---|---|---|---|---|---|---|---|---|---|---|---|
| Country | Beginning Stocks | Production | Import | Export | Consumption | Ending Stocks | ||||||
| World | 183.19 | -2.4% | 514.42 | +0.3% | 55.67 | +2.2% | 54.07 | -5.0% | 521.24 | +1.2% | 177.97 | -2.8% |
| China | 113.00 | -3.0% | 145.95 | -2.0% | 4.38 | -26.3% | 1.74 | -16.5% | 154.99 | -0.9% | 106.60 | -5.7% |
| Share % | 61.7% | 28.4% | 7.9% | 3.2% | 29.7% | 59.9% | ||||||
| India | 34.00 | -8.1% | 135.76 | +4.9% | 0.00 | 0.0% | 20.25 | -8.1% | 114.51 | +3.7% | 35.00 | +2.9% |
| Share % | 18.6% | 26.4% | 0.0% | 37.5% | 22.0% | 19.7% | ||||||
| Bangladesh | 2.09 | +43.4% | 36.35 | +1.4% | 1.28 | -1.9% | 0.01 | -70.6% | 37.50 | +2.7% | 2.21 | +5.7% |
| Share % | 1.1% | 7.1% | 2.3% | 0.0% | 7.2% | 1.2% | ||||||
| Indonesia | 2.90 | -5.2% | 33.90 | -1.5% | 3.50 | +373.0% | 0.00 | 0.0% | 35.60 | +0.8% | 4.70 | +62.1% |
| Share % | 1.6% | 6.6% | 6.3% | 0.0% | 6.8% | 2.6% | ||||||
| Vietnam | 2.66 | -3.1% | 26.94 | +1.0% | 1.80 | +5.9% | 8.23 | +16.6% | 21.40 | 0.0% | 1.77 | -33.3% |
| Share % | 1.5% | 5.2% | 3.2% | 15.2% | 4.1% | 1.0% | ||||||
| Source: USDA, Last Update: 2024-04-12 | Visit the page with more detailed information | |||||||||||
|
Sorghum
| Balance sheet in Mio Tons
Year 2023-24 (Forecast April)
Sorghum US - Price
Decreasing |
||||||||||||
|---|---|---|---|---|---|---|---|---|---|---|---|---|
| Country | Beginning Stocks | Production | Import | Export | Consumption | Ending Stocks | ||||||
| World | 3.69 | -10.0% | 59.71 | +7.9% | 8.96 | +46.3% | 9.55 | +53.1% | 59.09 | +6.2% | 3.72 | +1.1% |
| United States | 0.62 | -48.7% | 8.07 | +69.2% | 0.00 | +∞ | 6.22 | +124.6% | 1.91 | -26.3% | 0.56 | -9.1% |
| Share % | 16.8% | 13.5% | 0.0% | 65.1% | 3.2% | 15.1% | ||||||
| Nigeria | 0.17 | +31.8% | 6.70 | -0.6% | 0.00 | 0.0% | 0.05 | 0.0% | 6.65 | 0.0% | 0.17 | 0.0% |
| Share % | 4.6% | 11.2% | 0.0% | 0.5% | 11.3% | 4.6% | ||||||
| Sudan | 0.30 | +104.1% | 5.00 | -4.7% | 0.05 | -55.0% | 0.01 | 0.0% | 5.10 | -1.9% | 0.25 | -18.2% |
| Share % | 8.1% | 8.4% | 0.6% | 0.1% | 8.6% | 6.7% | ||||||
| India | 0.14 | -47.7% | 4.40 | +15.4% | 0.00 | 0.0% | 0.03 | -18.9% | 4.30 | +10.3% | 0.21 | +51.9% |
| Share % | 3.8% | 7.4% | 0.0% | 0.3% | 7.3% | 5.6% | ||||||
| Ethiopia | 0.06 | -66.1% | 4.40 | +13.5% | 0.01 | -71.4% | 0.03 | 0.0% | 4.30 | +7.5% | 0.14 | +146.6% |
| Share % | 1.6% | 7.4% | 0.1% | 0.3% | 7.3% | 3.8% | ||||||
| Source: USDA - WASDE, Last Update: 2024-04-12 | Visit the page with more detailed information | |||||||||||
| Sorghum - Balance sheet in Mio Tons | Year 2023-24 (Forecast Marzo) | ||||||||||||
|---|---|---|---|---|---|---|---|---|---|---|---|---|
| Country | Beginning Stocks | Production | Import | Export | Consumption | Ending Stocks | ||||||
| World | 3.65 | -10.9% | 59.72 | +8.0% | 8.96 | +46.3% | 9.57 | +53.5% | 59.04 | +6.1% | 3.72 | +1.0% |
| United States | 0.62 | -48.7% | 8.07 | +69.2% | 0.00 | +∞ | 6.22 | +124.6% | 1.91 | -26.3% | 0.56 | -9.1% |
| Share % | 16.8% | 13.5% | 0.0% | 65.1% | 3.2% | 15.1% | ||||||
| Nigeria | 0.17 | +31.8% | 6.70 | -0.6% | 0.00 | 0.0% | 0.05 | 0.0% | 6.65 | 0.0% | 0.17 | 0.0% |
| Share % | 4.6% | 11.2% | 0.0% | 0.5% | 11.3% | 4.6% | ||||||
| Sudan | 0.30 | +104.1% | 5.00 | -4.7% | 0.05 | -55.0% | 0.01 | 0.0% | 5.10 | -1.9% | 0.25 | -18.2% |
| Share % | 8.1% | 8.4% | 0.6% | 0.1% | 8.6% | 6.7% | ||||||
| India | 0.14 | -47.7% | 4.40 | +15.4% | 0.00 | 0.0% | 0.05 | +35.1% | 4.25 | +9.0% | 0.24 | +74.1% |
| Share % | 3.8% | 7.4% | 0.0% | 0.5% | 7.2% | 6.5% | ||||||
| Ethiopia | 0.06 | -66.1% | 4.40 | +13.5% | 0.01 | -71.4% | 0.03 | 0.0% | 4.30 | +7.5% | 0.14 | +146.6% |
| Share % | 1.6% | 7.4% | 0.1% | 0.3% | 7.3% | 3.8% | ||||||
| Source: USDA, Last Update: 2024-04-12 | Visit the page with more detailed information | |||||||||||
| Sorghum - Balance sheet in Mio Tons | Year 2022-23 | ||||||||||||
|---|---|---|---|---|---|---|---|---|---|---|---|---|
| Country | Beginning Stocks | Production | Import | Export | Consumption | Ending Stocks | ||||||
| World | 4.10 | +3.2% | 55.32 | -9.2% | 6.13 | -51.2% | 6.24 | -47.0% | 55.62 | -9.7% | 3.69 | -10.0% |
| United States | 1.20 | +132.8% | 4.77 | -58.1% | 0.00 | 0.0% | 2.77 | -63.1% | 2.58 | -18.6% | 0.62 | -48.7% |
| Share % | 29.3% | 8.6% | 0.0% | 44.4% | 4.6% | 16.8% | ||||||
| Nigeria | 0.13 | +23.4% | 6.74 | +0.3% | 0.00 | 0.0% | 0.05 | 0.0% | 6.65 | 0.0% | 0.17 | +31.8% |
| Share % | 3.2% | 12.2% | 0.0% | 0.8% | 12.0% | 4.6% | ||||||
| Sudan | 0.15 | -47.1% | 5.25 | +48.8% | 0.11 | +48.0% | 0.01 | -85.7% | 5.20 | +40.5% | 0.30 | +104.1% |
| Share % | 3.7% | 9.5% | 1.8% | 0.2% | 9.3% | 8.1% | ||||||
| India | 0.26 | -56.9% | 3.81 | -8.1% | 0.00 | 0.0% | 0.04 | -7.5% | 3.90 | -12.4% | 0.14 | -47.7% |
| Share % | 6.3% | 6.9% | 0.0% | 0.6% | 7.0% | 3.8% | ||||||
| Ethiopia | 0.17 | -55.5% | 3.88 | -12.9% | 0.04 | +191.7% | 0.03 | 0.0% | 4.00 | -14.0% | 0.06 | -66.1% |
| Share % | 4.1% | 7.0% | 0.7% | 0.5% | 7.2% | 1.6% | ||||||
| Source: USDA, Last Update: 2024-04-12 | Visit the page with more detailed information | |||||||||||
| Soybean Meal - Balance sheet in Mio Tons | Year 2023-24 (Forecast April) | ||||||||||||
|---|---|---|---|---|---|---|---|---|---|---|---|---|
| Country | Beginning Stocks | Production | Import | Export | Consumption | Ending Stocks | ||||||
| World | 13.28 | -19.2% | 257.68 | +4.0% | 67.41 | +7.1% | 70.49 | +4.8% | 253.59 | +2.8% | 14.30 | +7.6% |
| China | 0.94 | +32.0% | 77.62 | +2.1% | 0.05 | +25.0% | 1.00 | +25.8% | 76.75 | +2.3% | 0.85 | -9.0% |
| Share % | 7.1% | 30.1% | 0.1% | 1.4% | 30.3% | 5.9% | ||||||
| United States | 0.34 | +19.1% | 49.22 | +3.4% | 0.54 | -5.1% | 14.33 | +7.8% | 35.40 | +1.6% | 0.36 | +8.0% |
| Share % | 2.6% | 19.1% | 0.8% | 20.3% | 14.0% | 2.5% | ||||||
| Brazil | 3.39 | -12.7% | 41.08 | -0.2% | 0.01 | +66.7% | 20.60 | -3.5% | 20.50 | +1.0% | 3.38 | -0.4% |
| Share % | 25.5% | 15.9% | 0.0% | 29.2% | 8.1% | 23.6% | ||||||
| Argentina | 2.36 | -15.6% | 27.69 | +17.1% | 0.01 | -85.1% | 24.40 | +17.6% | 3.48 | +2.2% | 2.19 | -7.4% |
| Share % | 17.8% | 10.7% | 0.0% | 34.6% | 1.4% | 15.3% | ||||||
| EU-27 | 0.49 | -26.3% | 11.77 | +4.2% | 15.80 | -1.3% | 0.70 | -5.4% | 26.74 | 0.0% | 0.61 | +26.6% |
| Share % | 3.7% | 4.6% | 23.4% | 1.0% | 10.5% | 4.3% | ||||||
| Source: USDA - WASDE, Last Update: 2024-04-12 | Visit the page with more detailed information | |||||||||||
| Soybean Meal - Balance sheet in Mio Tons | Year 2023-24 (Forecast Marzo) | ||||||||||||
|---|---|---|---|---|---|---|---|---|---|---|---|---|
| Country | Beginning Stocks | Production | Import | Export | Consumption | Ending Stocks | ||||||
| World | 13.70 | -16.6% | 257.76 | +4.0% | 66.95 | +6.3% | 70.03 | +4.1% | 253.49 | +2.8% | 14.89 | +12.1% |
| China | 0.94 | +32.0% | 77.62 | +2.1% | 0.05 | +25.0% | 1.00 | +25.8% | 76.75 | +2.3% | 0.85 | -9.0% |
| Share % | 7.1% | 30.1% | 0.1% | 1.4% | 30.3% | 5.9% | ||||||
| United States | 0.34 | +19.1% | 49.22 | +3.4% | 0.54 | -5.1% | 14.33 | +7.8% | 35.40 | +1.6% | 0.36 | +8.0% |
| Share % | 2.6% | 19.1% | 0.8% | 20.3% | 14.0% | 2.5% | ||||||
| Brazil | 3.39 | -12.7% | 41.08 | -0.2% | 0.01 | +66.7% | 20.10 | -5.8% | 20.70 | +2.0% | 3.68 | +8.4% |
| Share % | 25.5% | 15.9% | 0.0% | 28.5% | 8.2% | 25.7% | ||||||
| Argentina | 2.36 | -15.6% | 27.69 | +17.1% | 0.01 | -85.1% | 24.40 | +17.6% | 3.48 | +2.2% | 2.19 | -7.4% |
| Share % | 17.8% | 10.7% | 0.0% | 34.6% | 1.4% | 15.3% | ||||||
| EU-27 | 0.44 | -33.9% | 11.77 | +4.2% | 15.80 | -1.3% | 0.70 | -5.4% | 26.84 | +0.4% | 0.46 | -4.3% |
| Share % | 3.3% | 4.6% | 23.4% | 1.0% | 10.6% | 3.2% | ||||||
| Source: USDA, Last Update: 2024-04-12 | Visit the page with more detailed information | |||||||||||
| Soybean Meal - Balance sheet in Mio Tons | Year 2022-23 | ||||||||||||
|---|---|---|---|---|---|---|---|---|---|---|---|---|
| Country | Beginning Stocks | Production | Import | Export | Consumption | Ending Stocks | ||||||
| World | 16.43 | +4.3% | 247.77 | -0.3% | 62.97 | -6.2% | 67.27 | -2.2% | 246.61 | +0.2% | 13.28 | -19.2% |
| China | 0.71 | -25.9% | 76.03 | +6.7% | 0.04 | -28.6% | 0.80 | +64.3% | 75.05 | +5.6% | 0.94 | +32.0% |
| Share % | 4.3% | 30.7% | 0.1% | 1.2% | 30.4% | 7.1% | ||||||
| United States | 0.28 | -8.7% | 47.62 | +1.3% | 0.57 | -3.5% | 13.30 | +8.3% | 34.84 | -1.4% | 0.34 | +19.1% |
| Share % | 1.7% | 19.2% | 0.9% | 19.8% | 14.1% | 2.6% | ||||||
| Brazil | 3.88 | -13.2% | 41.14 | +4.7% | 0.01 | -50.0% | 21.34 | +5.6% | 20.30 | +3.0% | 3.39 | -12.7% |
| Share % | 23.6% | 16.6% | 0.0% | 31.7% | 8.2% | 25.5% | ||||||
| Argentina | 2.80 | +22.2% | 23.65 | -21.9% | 0.07 | -50.4% | 20.75 | -22.0% | 3.40 | +2.3% | 2.36 | -15.6% |
| Share % | 17.0% | 9.5% | 0.1% | 30.8% | 1.4% | 17.8% | ||||||
| EU-27 | 0.66 | +42.4% | 11.30 | -7.1% | 16.01 | -3.2% | 0.74 | -3.1% | 26.74 | -3.6% | 0.49 | -26.3% |
| Share % | 4.0% | 4.6% | 25.4% | 1.1% | 10.8% | 3.7% | ||||||
| Source: USDA, Last Update: 2024-04-12 | Visit the page with more detailed information | |||||||||||
| Sunflower Meal - Balance sheet in Mio Tons | Year 2023-24 (Forecast April) | ||||||||||||
|---|---|---|---|---|---|---|---|---|---|---|---|---|
| Country | Beginning Stocks | Production | Import | Export | Consumption | Ending Stocks | ||||||
| World | 1.53 | +57.7% | 22.98 | 0.0% | 9.55 | +11.5% | 9.92 | +8.8% | 22.65 | +3.6% | 1.48 | -3.1% |
| Russia | 0.40 | +346.1% | 6.78 | +5.1% | 0.01 | 0.0% | 2.65 | +17.8% | 4.13 | +5.8% | 0.41 | +2.5% |
| Share % | 26.1% | 29.5% | 0.1% | 26.7% | 18.2% | 27.7% | ||||||
| Ukraine | 0.25 | +97.6% | 6.07 | +5.0% | 0.01 | -23.1% | 4.70 | +18.3% | 1.40 | -17.6% | 0.23 | -7.7% |
| Share % | 16.3% | 26.4% | 0.1% | 47.4% | 6.2% | 15.5% | ||||||
| EU-27 | 0.32 | +10.3% | 4.97 | -3.2% | 2.80 | +1.6% | 0.75 | -25.1% | 6.96 | +1.5% | 0.38 | +19.7% |
| Share % | 20.9% | 21.6% | 29.3% | 7.6% | 30.7% | 25.7% | ||||||
| Argentina | 0.12 | -4.0% | 1.64 | -3.6% | 0.00 | 0.0% | 1.10 | +2.3% | 0.54 | -15.0% | 0.12 | +2.5% |
| Share % | 7.8% | 7.1% | 0.0% | 11.1% | 2.4% | 8.1% | ||||||
| Turkey | 0.22 | +97.3% | 1.04 | -22.4% | 1.05 | +19.5% | 0.02 | -80.8% | 2.15 | +6.2% | 0.14 | -35.9% |
| Share % | 14.4% | 4.5% | 11.0% | 0.2% | 9.5% | 9.5% | ||||||
| Source: USDA - WASDE, Last Update: 2024-04-12 | Visit the page with more detailed information | |||||||||||
| Sunflower Meal - Balance sheet in Mio Tons | Year 2023-24 (Forecast Marzo) | ||||||||||||
|---|---|---|---|---|---|---|---|---|---|---|---|---|
| Country | Beginning Stocks | Production | Import | Export | Consumption | Ending Stocks | ||||||
| World | 1.63 | +68.4% | 22.87 | -0.5% | 9.38 | +9.5% | 9.76 | +7.0% | 22.77 | +4.1% | 1.35 | -11.8% |
| Russia | 0.40 | +346.1% | 6.78 | +5.1% | 0.01 | 0.0% | 2.65 | +17.8% | 4.13 | +5.8% | 0.41 | +2.5% |
| Share % | 26.1% | 29.5% | 0.1% | 26.7% | 18.2% | 27.7% | ||||||
| Ukraine | 0.45 | +257.6% | 5.87 | +1.4% | 0.01 | -23.1% | 4.70 | +18.3% | 1.40 | -17.6% | 0.22 | -10.1% |
| Share % | 29.4% | 25.5% | 0.1% | 47.4% | 6.2% | 14.9% | ||||||
| EU-27 | 0.22 | -24.1% | 4.92 | -4.2% | 2.70 | -2.0% | 0.65 | -35.1% | 6.96 | +1.5% | 0.23 | -28.4% |
| Share % | 14.4% | 21.4% | 28.3% | 6.6% | 30.7% | 15.5% | ||||||
| Argentina | 0.12 | -4.0% | 1.64 | -3.6% | 0.00 | 0.0% | 1.10 | +2.3% | 0.54 | -15.0% | 0.12 | +2.5% |
| Share % | 7.8% | 7.1% | 0.0% | 11.1% | 2.4% | 8.1% | ||||||
| Turkey | 0.22 | +97.3% | 1.16 | -12.9% | 1.00 | +13.8% | 0.02 | -80.8% | 2.20 | +8.6% | 0.17 | -23.8% |
| Share % | 14.4% | 5.0% | 10.5% | 0.2% | 9.7% | 11.5% | ||||||
| Source: USDA, Last Update: 2024-04-12 | Visit the page with more detailed information | |||||||||||
| Sunflower Meal - Balance sheet in Mio Tons | Year 2022-23 | ||||||||||||
|---|---|---|---|---|---|---|---|---|---|---|---|---|
| Country | Beginning Stocks | Production | Import | Export | Consumption | Ending Stocks | ||||||
| World | 0.97 | -21.1% | 22.98 | +8.5% | 8.57 | +16.6% | 9.12 | +16.4% | 21.87 | +4.4% | 1.53 | +57.7% |
| Russia | 0.09 | +8.5% | 6.45 | +12.1% | 0.01 | +66.7% | 2.25 | +12.5% | 3.90 | +4.0% | 0.40 | +346.1% |
| Share % | 9.3% | 28.1% | 0.1% | 24.7% | 17.8% | 26.1% | ||||||
| Ukraine | 0.13 | -47.3% | 5.78 | +29.6% | 0.01 | +333.3% | 3.97 | +21.3% | 1.70 | +30.8% | 0.25 | +97.6% |
| Share % | 13.4% | 25.2% | 0.1% | 43.5% | 7.8% | 16.3% | ||||||
| EU-27 | 0.29 | +11.5% | 5.14 | -8.6% | 2.76 | +7.5% | 1.00 | +0.7% | 6.86 | -4.2% | 0.32 | +10.3% |
| Share % | 29.9% | 22.4% | 32.2% | 11.0% | 31.4% | 20.9% | ||||||
| Argentina | 0.13 | -1.6% | 1.71 | +12.6% | 0.00 | 0.0% | 1.08 | +10.1% | 0.64 | +17.6% | 0.12 | -4.0% |
| Share % | 13.4% | 7.4% | 0.0% | 11.8% | 2.9% | 7.8% | ||||||
| Turkey | 0.11 | -49.3% | 1.33 | +15.4% | 0.88 | +7.2% | 0.08 | +116.7% | 2.03 | -1.2% | 0.22 | +97.3% |
| Share % | 11.3% | 5.8% | 10.3% | 0.9% | 9.3% | 14.4% | ||||||
| Source: USDA, Last Update: 2024-04-12 | Visit the page with more detailed information | |||||||||||
Show the data of:
Previous season
Current season
| Previous forecast
| Current forecast
Show the data of:
Previous season
Current season
| Previous forecast
| Current forecast
| Live Swine - Balance sheet in Mio capi | Year 2024 (Forecast April) | |||||||||||||||
|---|---|---|---|---|---|---|---|---|---|---|---|---|---|---|---|
| Country | Beginning Stocks | Production | Import | Export | SLAUGHTERS | Losses | Ending Stocks | ||||||||
| World |
Login to consult this balance
The login can be done from the bar at the top of the page, by clicking on "Login" on the right, next to the flags. Don't Have an Account? Click here to sign up. |
||||||||||||||
| China | |||||||||||||||
| EU-27 | |||||||||||||||
| United States | |||||||||||||||
| Russia | |||||||||||||||
| Brazil | |||||||||||||||
| Source: USDA, Last Update: 2024-04-12 | Visit the page with more detailed information | ||||||||||||||
| Pork Meat - Balance sheet in Mio Tons | Year 2024 (Forecast April) | |||||||||||||
|---|---|---|---|---|---|---|---|---|---|---|---|---|---|
| Country | Beginning Stocks | Production | Import | Export | Consumption | Ending Stocks | |||||||
| World |
Login to consult this balance
The login can be done from the bar at the top of the page, by clicking on "Login" on the right, next to the flags. Don't Have an Account? Click here to sign up. |
||||||||||||
| China | |||||||||||||
| EU-27 | |||||||||||||
| United States | |||||||||||||
| Brazil | |||||||||||||
| Russia | |||||||||||||
| Source: USDA, Last Update: 2024-04-12 | Visit the page with more detailed information | ||||||||||||
Show the data of:
Previous season
Current season
Show the data of:
Previous season
Current season
| Live Bovine - Balance sheet in Mio capi | Year 2024 (Forecast April) | |||||||||||||||
|---|---|---|---|---|---|---|---|---|---|---|---|---|---|---|---|
| Country | Beginning Stocks | Production | Import | Export | SLAUGHTERS | Losses | Ending Stocks | ||||||||
| World |
Login to consult this balance
The login can be done from the bar at the top of the page, by clicking on "Login" on the right, next to the flags. Don't Have an Account? Click here to sign up. |
||||||||||||||
| India | |||||||||||||||
| China | |||||||||||||||
| Brazil | |||||||||||||||
| United States | |||||||||||||||
| EU-27 | |||||||||||||||
| Source: USDA, Last Update: 2024-04-12 | Visit the page with more detailed information | ||||||||||||||
| Bovines Meat - Balance sheet in Mio Tons | Year 2024 (Forecast April) | |||||||||||||
|---|---|---|---|---|---|---|---|---|---|---|---|---|---|
| Country | Beginning Stocks | Production | Import | Export | Consumption | Ending Stocks | |||||||
| World |
Login to consult this balance
The login can be done from the bar at the top of the page, by clicking on "Login" on the right, next to the flags. Don't Have an Account? Click here to sign up. |
||||||||||||
| United States | |||||||||||||
| Brazil | |||||||||||||
| China | |||||||||||||
| EU-27 | |||||||||||||
| India | |||||||||||||
| Source: USDA, Last Update: 2024-04-12 | Visit the page with more detailed information | ||||||||||||
Show the data of:
Previous season
Current season
| Chicken Meat - Balance sheet in Mio tons | Year 2024 (Forecast April) | |||||||||||||
|---|---|---|---|---|---|---|---|---|---|---|---|---|---|
| Country | Beginning Stocks | Production | Import | Export | Consumption | Ending Stocks | |||||||
| World |
Login to consult this balance
The login can be done from the bar at the top of the page, by clicking on "Login" on the right, next to the flags. Don't Have an Account? Click here to sign up. |
||||||||||||
| United States | |||||||||||||
| Brazil | |||||||||||||
| China | |||||||||||||
| EU-27 | |||||||||||||
| Russia | |||||||||||||
| Source: USDA, Last Update: 2024-04-12 | |||||||||||||
Show the data of:
Previous season
Current season
| Previous forecast
| Current forecast
Show the data of:
Previous season
Current season
Show the data of:
Previous season
Current season
| Previous forecast
| Current forecast
| Almonds - Balance sheet in Tons x 1000 | Year 2023-24 (Forecast February) | |||||||||||||
|---|---|---|---|---|---|---|---|---|---|---|---|---|---|
| Country | Beginning Stocks | Production | Import | Export | Consumption | Ending Stocks | |||||||
| World |
Login to consult this balance
The login can be done from the bar at the top of the page, by clicking on "Login" on the right, next to the flags. Don't Have an Account? Click here to sign up. |
||||||||||||
| United States | |||||||||||||
| EU-28 | |||||||||||||
| Australia | |||||||||||||
| Turkey | |||||||||||||
| Chile | |||||||||||||
| Source: USDA, Last Update: 2024-02-16 | |||||||||||||
| Pistachios - Balance sheet in Tons x 1000 | Year 2023-24 (Forecast February) | |||||||||||||
|---|---|---|---|---|---|---|---|---|---|---|---|---|---|
| Country | Beginning Stocks | Production | Import | Export | Consumption | Ending Stocks | |||||||
| World |
Login to consult this balance
The login can be done from the bar at the top of the page, by clicking on "Login" on the right, next to the flags. Don't Have an Account? Click here to sign up. |
||||||||||||
| United States | |||||||||||||
| Turkey | |||||||||||||
| Iran | |||||||||||||
| Syria | |||||||||||||
| EU-28 | |||||||||||||
| Source: USDA, Last Update: 2024-02-16 | |||||||||||||
| Walnuts - Balance sheet in Tons x 1000 | Year 2023-24 (Forecast February) | |||||||||||||
|---|---|---|---|---|---|---|---|---|---|---|---|---|---|
| Country | Beginning Stocks | Production | Import | Export | Consumption | Ending Stocks | |||||||
| World |
Login to consult this balance
The login can be done from the bar at the top of the page, by clicking on "Login" on the right, next to the flags. Don't Have an Account? Click here to sign up. |
||||||||||||
| China | |||||||||||||
| United States | |||||||||||||
| Chile | |||||||||||||
| EU-28 | |||||||||||||
| Ukraine | |||||||||||||
| Source: USDA, Last Update: 2024-02-16 | |||||||||||||
Show the data of:
Annata precedente
Current season
| Previous forecast
| Current forecast
Show the data of:
Annata precedente
Current season
| Previous forecast
| Current forecast
Show the data of:
Annata precedente
Current season
| Previous forecast
| Current forecast
Show the data of:
Annata precedente
Current season
| Previous forecast
| Current forecast
Show the data of:
Annata precedente
Current season
| Previous forecast
| Current forecast
Show the data of:
Annata precedente
Current season
| Previous forecast
| Current forecast
Show the data of:
Annata precedente
Current season
| Previous forecast
| Current forecast
Show the data of:
Annata precedente
Current season
| Previous forecast
| Current forecast
Show the data of:
Annata precedente
Current season
| Previous forecast
| Current forecast
| Coconut Oil - Balance sheet in Mio Tons | Year 2023-24 (Forecast April) | ||||||||||||
|---|---|---|---|---|---|---|---|---|---|---|---|---|
| Country | Beginning Stocks | Production | Import | Export | Consumption | Ending Stocks | ||||||
| World | 0.86 | -6.6% | 3.77 | +1.3% | 1.87 | -3.9% | 2.01 | -7.8% | 3.66 | +2.9% | 0.84 | -2.4% |
| Philippines | 0.05 | -32.8% | 1.73 | +3.7% | 0.00 | +∞ | 1.03 | -9.6% | 0.67 | +21.8% | 0.08 | +75.6% |
| Share % | 5.8% | 45.9% | 0.0% | 51.2% | 18.3% | 9.5% | ||||||
| Indonesia | 0.21 | -28.9% | 1.03 | +0.4% | 0.07 | +204.3% | 0.70 | -4.5% | 0.41 | +1.3% | 0.20 | -2.4% |
| Share % | 24.4% | 27.3% | 3.7% | 34.8% | 11.2% | 23.8% | ||||||
| India | 0.12 | -0.8% | 0.57 | 0.0% | 0.00 | 0.0% | 0.02 | -6.3% | 0.57 | +1.8% | 0.11 | -8.5% |
| Share % | 14.0% | 15.1% | 0.0% | 1.0% | 15.6% | 13.1% | ||||||
| Vietnam | 0.01 | -15.4% | 0.18 | 0.0% | 0.00 | 0.0% | 0.01 | +42.9% | 0.18 | -2.2% | 0.01 | -9.1% |
| Share % | 1.2% | 4.8% | 0.0% | 0.5% | 4.9% | 1.2% | ||||||
| Papua New Guinea | 0.08 | +31.6% | 0.05 | -22.4% | 0.00 | 0.0% | 0.04 | +11.4% | 0.01 | 0.0% | 0.08 | +1.3% |
| Share % | 9.3% | 1.3% | 0.0% | 2.0% | 0.3% | 9.5% | ||||||
| Source: USDA, Last Update: 2024-04-12 | ||||||||||||
| Coconut Oil - Balance sheet in Mio Tons | Year 2023-24 (Forecast Marzo) | ||||||||||||
|---|---|---|---|---|---|---|---|---|---|---|---|---|
| Country | Beginning Stocks | Production | Import | Export | Consumption | Ending Stocks | ||||||
| World | 0.88 | -5.3% | 3.77 | +1.2% | 1.90 | -2.6% | 2.01 | -7.8% | 3.68 | +3.6% | 0.85 | -1.2% |
| Philippines | 0.05 | -32.8% | 1.73 | +3.7% | 0.00 | +∞ | 1.03 | -9.6% | 0.67 | +21.8% | 0.08 | +75.6% |
| Share % | 5.7% | 45.9% | 0.0% | 51.2% | 18.2% | 9.4% | ||||||
| Indonesia | 0.21 | -28.9% | 1.03 | +0.4% | 0.07 | +204.3% | 0.70 | -4.5% | 0.41 | +1.3% | 0.20 | -2.4% |
| Share % | 23.9% | 27.3% | 3.7% | 34.8% | 11.1% | 23.5% | ||||||
| India | 0.12 | -0.8% | 0.57 | 0.0% | 0.00 | 0.0% | 0.02 | -6.3% | 0.57 | +1.8% | 0.11 | -8.5% |
| Share % | 13.6% | 15.1% | 0.0% | 1.0% | 15.5% | 12.9% | ||||||
| Vietnam | 0.01 | -15.4% | 0.18 | 0.0% | 0.00 | 0.0% | 0.01 | +42.9% | 0.18 | -2.2% | 0.01 | -9.1% |
| Share % | 1.1% | 4.8% | 0.0% | 0.5% | 4.9% | 1.2% | ||||||
| Papua New Guinea | 0.09 | +57.9% | 0.04 | -24.1% | 0.00 | 0.0% | 0.04 | +11.4% | 0.01 | 0.0% | 0.09 | +20.0% |
| Share % | 10.2% | 1.1% | 0.0% | 2.0% | 0.3% | 10.6% | ||||||
| Source: USDA, Last Update: 2024-04-12 | ||||||||||||
| Coconut Oil - Balance sheet in Mio Tons | Year 2022-23 | ||||||||||||
|---|---|---|---|---|---|---|---|---|---|---|---|---|
| Country | Beginning Stocks | Production | Import | Export | Consumption | Ending Stocks | ||||||
| World | 0.92 | +16.5% | 3.72 | -0.3% | 1.95 | -12.8% | 2.18 | -2.9% | 3.55 | -1.1% | 0.86 | -6.6% |
| Philippines | 0.07 | -51.8% | 1.67 | 0.0% | 0.00 | -100.0% | 1.14 | -9.3% | 0.55 | +13.6% | 0.05 | -32.8% |
| Share % | 7.6% | 44.9% | 0.0% | 52.3% | 15.5% | 5.8% | ||||||
| Indonesia | 0.29 | +1.7% | 1.03 | -0.9% | 0.02 | -68.9% | 0.73 | +7.0% | 0.40 | -4.5% | 0.21 | -28.9% |
| Share % | 31.5% | 27.7% | 1.0% | 33.5% | 11.3% | 24.4% | ||||||
| India | 0.12 | -2.5% | 0.57 | 0.0% | 0.00 | 0.0% | 0.02 | -42.9% | 0.56 | +1.8% | 0.12 | -0.8% |
| Share % | 13.0% | 15.3% | 0.0% | 0.9% | 15.8% | 14.0% | ||||||
| Vietnam | 0.01 | -13.3% | 0.18 | +0.6% | 0.00 | 0.0% | 0.01 | -30.0% | 0.18 | +2.3% | 0.01 | -15.4% |
| Share % | 1.1% | 4.8% | 0.0% | 0.5% | 5.1% | 1.2% | ||||||
| Papua New Guinea | 0.06 | -13.6% | 0.06 | +41.5% | 0.00 | 0.0% | 0.04 | -22.2% | 0.01 | 0.0% | 0.08 | +31.6% |
| Share % | 6.5% | 1.6% | 0.0% | 1.8% | 0.3% | 9.3% | ||||||
| Source: USDA, Last Update: 2024-04-12 | ||||||||||||
| Cottonseed Oil - Balance sheet in Mio Tons | Year 2023-24 (Forecast April) | ||||||||||||
|---|---|---|---|---|---|---|---|---|---|---|---|---|
| Country | Beginning Stocks | Production | Import | Export | Consumption | Ending Stocks | ||||||
| World | 0.18 | +7.4% | 4.96 | +1.1% | 0.08 | -6.9% | 0.08 | -23.8% | 4.96 | +1.8% | 0.18 | 0.0% |
| China | 0.00 | 0.0% | 1.35 | -8.8% | 0.00 | 0.0% | 0.01 | -28.6% | 1.35 | -8.7% | 0.00 | 0.0% |
| Share % | 0.0% | 27.2% | 0.0% | 12.5% | 27.2% | 0.0% | ||||||
| India | 0.04 | +32.1% | 1.33 | -3.1% | 0.00 | +200.0% | 0.00 | 0.0% | 1.32 | -3.0% | 0.05 | +24.3% |
| Share % | 22.2% | 26.8% | 0.0% | 0.0% | 26.6% | 27.8% | ||||||
| Brazil | 0.02 | -41.7% | 0.72 | +25.0% | 0.00 | +∞ | 0.01 | -45.5% | 0.70 | +20.7% | 0.04 | +71.4% |
| Share % | 11.1% | 14.5% | 0.0% | 12.5% | 14.1% | 22.2% | ||||||
| Pakistan | 0.01 | +12.5% | 0.42 | +62.5% | 0.00 | 0.0% | 0.00 | 0.0% | 0.41 | +58.8% | 0.02 | +122.2% |
| Share % | 5.6% | 8.5% | 0.0% | 0.0% | 8.3% | 11.1% | ||||||
| Turkey | 0.04 | +157.1% | 0.19 | -34.1% | 0.00 | +100.0% | 0.01 | -37.5% | 0.22 | -16.9% | 0.01 | -80.6% |
| Share % | 22.2% | 3.8% | 0.0% | 12.5% | 4.4% | 5.6% | ||||||
| Source: USDA, Last Update: 2024-04-12 | ||||||||||||
| Cottonseed Oil - Balance sheet in Mio Tons | Year 2023-24 (Forecast Marzo) | ||||||||||||
|---|---|---|---|---|---|---|---|---|---|---|---|---|
| Country | Beginning Stocks | Production | Import | Export | Consumption | Ending Stocks | ||||||
| World | 0.18 | +9.8% | 4.95 | +1.0% | 0.08 | -3.4% | 0.09 | -15.8% | 4.92 | +0.9% | 0.21 | +18.3% |
| China | 0.00 | 0.0% | 1.35 | -8.8% | 0.00 | 0.0% | 0.01 | -28.6% | 1.35 | -8.7% | 0.00 | 0.0% |
| Share % | 0.0% | 27.3% | 0.0% | 11.1% | 27.4% | 0.0% | ||||||
| India | 0.04 | +32.1% | 1.33 | -3.1% | 0.00 | +200.0% | 0.00 | 0.0% | 1.30 | -4.8% | 0.07 | +89.2% |
| Share % | 22.2% | 26.9% | 0.0% | 0.0% | 26.4% | 33.3% | ||||||
| Brazil | 0.02 | -41.7% | 0.72 | +25.0% | 0.00 | +∞ | 0.01 | -45.5% | 0.70 | +20.7% | 0.04 | +71.4% |
| Share % | 11.1% | 14.5% | 0.0% | 11.1% | 14.2% | 19.0% | ||||||
| Pakistan | 0.01 | +50.0% | 0.40 | +56.3% | 0.00 | 0.0% | 0.00 | 0.0% | 0.39 | +51.0% | 0.03 | +200.0% |
| Share % | 5.6% | 8.1% | 0.0% | 0.0% | 7.9% | 14.3% | ||||||
| Turkey | 0.04 | +157.1% | 0.19 | -34.1% | 0.00 | +100.0% | 0.01 | -12.5% | 0.22 | -17.6% | 0.01 | -80.6% |
| Share % | 22.2% | 3.8% | 0.0% | 11.1% | 4.5% | 4.8% | ||||||
| Source: USDA, Last Update: 2024-04-12 | ||||||||||||
| Cottonseed Oil - Balance sheet in Mio Tons | Year 2022-23 | ||||||||||||
|---|---|---|---|---|---|---|---|---|---|---|---|---|
| Country | Beginning Stocks | Production | Import | Export | Consumption | Ending Stocks | ||||||
| World | 0.16 | -14.7% | 4.90 | +1.1% | 0.09 | -26.9% | 0.10 | -19.8% | 4.87 | +0.1% | 0.18 | +7.4% |
| China | 0.00 | 0.0% | 1.48 | +8.5% | 0.00 | 0.0% | 0.01 | +40.0% | 1.48 | +8.4% | 0.00 | 0.0% |
| Share % | 0.0% | 30.2% | 0.0% | 10.0% | 30.4% | 0.0% | ||||||
| India | 0.03 | +27.3% | 1.37 | +5.6% | 0.00 | -75.0% | 0.00 | 0.0% | 1.36 | +5.1% | 0.04 | +32.1% |
| Share % | 18.8% | 28.0% | 0.0% | 0.0% | 27.9% | 22.2% | ||||||
| Brazil | 0.04 | -40.0% | 0.58 | +2.9% | 0.00 | -100.0% | 0.01 | +120.0% | 0.58 | 0.0% | 0.02 | -41.7% |
| Share % | 25.0% | 11.8% | 0.0% | 10.0% | 11.9% | 11.1% | ||||||
| Pakistan | 0.01 | +14.3% | 0.26 | -34.9% | 0.00 | 0.0% | 0.00 | 0.0% | 0.26 | -34.9% | 0.01 | +12.5% |
| Share % | 6.3% | 5.3% | 0.0% | 0.0% | 5.3% | 5.6% | ||||||
| Turkey | 0.01 | +133.3% | 0.29 | +27.2% | 0.00 | 0.0% | 0.01 | +33.3% | 0.26 | +21.4% | 0.04 | +157.1% |
| Share % | 6.3% | 5.9% | 0.0% | 10.0% | 5.3% | 22.2% | ||||||
| Source: USDA, Last Update: 2024-04-12 | ||||||||||||
| Olive Oil - Balance sheet in Mio Tons | Year 2023-24 (Forecast April) | ||||||||||||
|---|---|---|---|---|---|---|---|---|---|---|---|---|
| Country | Beginning Stocks | Production | Import | Export | Consumption | Ending Stocks | ||||||
| World | 0.46 | -35.4% | 2.29 | -6.3% | 0.91 | -16.6% | 0.96 | -20.9% | 2.34 | -9.3% | 0.37 | -21.0% |
| EU-27 | 0.21 | -52.9% | 1.42 | +1.7% | 0.14 | -27.5% | 0.48 | -27.9% | 1.07 | -8.6% | 0.23 | +7.0% |
| Share % | 45.7% | 62.0% | 15.4% | 50.0% | 45.7% | 62.2% | ||||||
| Tunisia | 0.01 | -67.4% | 0.20 | +11.1% | 0.00 | 0.0% | 0.17 | -8.6% | 0.03 | 0.0% | 0.02 | +50.0% |
| Share % | 2.2% | 8.7% | 0.0% | 17.7% | 1.3% | 5.4% | ||||||
| Turkey | 0.08 | +523.1% | 0.19 | -50.0% | 0.04 | -38.5% | 0.14 | -25.1% | 0.15 | -21.1% | 0.02 | -74.1% |
| Share % | 17.4% | 8.3% | 4.4% | 14.6% | 6.4% | 5.4% | ||||||
| Morocco | 0.02 | -34.3% | 0.11 | -0.9% | 0.01 | -33.3% | 0.02 | +36.4% | 0.11 | -8.3% | 0.01 | -47.8% |
| Share % | 4.3% | 4.8% | 1.1% | 2.1% | 4.7% | 2.7% | ||||||
| Syria | 0.03 | -23.1% | 0.10 | -24.0% | 0.00 | 0.0% | 0.07 | -16.7% | 0.05 | 0.0% | 0.01 | -83.3% |
| Share % | 6.5% | 4.4% | 0.0% | 7.3% | 2.1% | 2.7% | ||||||
| Source: USDA, Last Update: 2024-04-12 | ||||||||||||
| Olive Oil - Balance sheet in Mio Tons | Year 2023-24 (Forecast Marzo) | ||||||||||||
|---|---|---|---|---|---|---|---|---|---|---|---|---|
| Country | Beginning Stocks | Production | Import | Export | Consumption | Ending Stocks | ||||||
| World | 0.46 | -35.4% | 2.29 | -6.3% | 0.91 | -16.6% | 0.96 | -20.9% | 2.34 | -9.3% | 0.37 | -21.0% |
| EU-27 | 0.21 | -52.9% | 1.42 | +1.7% | 0.14 | -27.5% | 0.48 | -27.9% | 1.07 | -8.6% | 0.23 | +7.0% |
| Share % | 45.7% | 62.0% | 15.4% | 50.0% | 45.7% | 62.2% | ||||||
| Tunisia | 0.01 | -67.4% | 0.20 | +11.1% | 0.00 | 0.0% | 0.17 | -8.6% | 0.03 | 0.0% | 0.02 | +50.0% |
| Share % | 2.2% | 8.7% | 0.0% | 17.7% | 1.3% | 5.4% | ||||||
| Turkey | 0.08 | +523.1% | 0.19 | -50.0% | 0.04 | -38.5% | 0.14 | -25.1% | 0.15 | -21.1% | 0.02 | -74.1% |
| Share % | 17.4% | 8.3% | 4.4% | 14.6% | 6.4% | 5.4% | ||||||
| Morocco | 0.02 | -34.3% | 0.11 | -0.9% | 0.01 | -33.3% | 0.02 | +36.4% | 0.11 | -8.3% | 0.01 | -47.8% |
| Share % | 4.3% | 4.8% | 1.1% | 2.1% | 4.7% | 2.7% | ||||||
| Syria | 0.03 | -23.1% | 0.10 | -24.0% | 0.00 | 0.0% | 0.07 | -16.7% | 0.05 | 0.0% | 0.01 | -83.3% |
| Share % | 6.5% | 4.4% | 0.0% | 7.3% | 2.1% | 2.7% | ||||||
| Source: USDA, Last Update: 2024-04-12 | ||||||||||||
| Olive Oil - Balance sheet in Mio Tons | Year 2022-23 | ||||||||||||
|---|---|---|---|---|---|---|---|---|---|---|---|---|
| Country | Beginning Stocks | Production | Import | Export | Consumption | Ending Stocks | ||||||
| World | 0.72 | +19.5% | 2.44 | -26.0% | 1.09 | -14.6% | 1.21 | -15.2% | 2.58 | -15.1% | 0.46 | -35.4% |
| EU-27 | 0.45 | +32.6% | 1.39 | -38.7% | 0.19 | +8.4% | 0.66 | -28.3% | 1.17 | -18.0% | 0.21 | -52.9% |
| Share % | 62.5% | 57.0% | 17.4% | 54.5% | 45.3% | 45.7% | ||||||
| Tunisia | 0.04 | +4.9% | 0.18 | -25.0% | 0.00 | +100.0% | 0.19 | -11.0% | 0.03 | -16.7% | 0.01 | -67.4% |
| Share % | 5.6% | 7.4% | 0.0% | 15.7% | 1.2% | 2.2% | ||||||
| Turkey | 0.01 | -45.8% | 0.38 | +61.7% | 0.07 | +195.5% | 0.19 | +139.7% | 0.19 | 0.0% | 0.08 | +523.1% |
| Share % | 1.4% | 15.6% | 6.4% | 15.7% | 7.4% | 17.4% | ||||||
| Morocco | 0.04 | +40.0% | 0.11 | -43.7% | 0.01 | +100.0% | 0.01 | -76.1% | 0.12 | -14.3% | 0.02 | -34.3% |
| Share % | 5.6% | 4.5% | 0.9% | 0.8% | 4.7% | 4.3% | ||||||
| Syria | 0.04 | +25.8% | 0.13 | +19.0% | 0.00 | 0.0% | 0.08 | +127.0% | 0.05 | -16.7% | 0.03 | -23.1% |
| Share % | 5.6% | 5.3% | 0.0% | 6.6% | 1.9% | 6.5% | ||||||
| Source: USDA, Last Update: 2024-04-12 | ||||||||||||
| Palm Oil - Balance sheet in Mio Tons | Year 2023-24 (Forecast April) | ||||||||||||
|---|---|---|---|---|---|---|---|---|---|---|---|---|
| Country | Beginning Stocks | Production | Import | Export | Consumption | Ending Stocks | ||||||
| World | 17.62 | +7.4% | 79.48 | +1.8% | 46.90 | 0.0% | 49.07 | -0.9% | 77.36 | +4.1% | 17.58 | -0.2% |
| Indonesia | 6.64 | -9.1% | 47.00 | +1.1% | 0.00 | 0.0% | 27.35 | -2.6% | 20.35 | +6.6% | 5.94 | -10.5% |
| Share % | 37.7% | 59.1% | 0.0% | 55.7% | 26.3% | 33.8% | ||||||
| Malaysia | 2.31 | -0.2% | 19.00 | +3.3% | 1.00 | +7.0% | 15.80 | +2.9% | 4.17 | +5.0% | 2.34 | +1.3% |
| Share % | 13.1% | 23.9% | 2.1% | 32.2% | 5.4% | 13.3% | ||||||
| Thailand | 0.31 | -35.7% | 3.45 | +1.0% | 0.00 | 0.0% | 0.55 | -39.0% | 2.77 | +3.0% | 0.44 | +44.8% |
| Share % | 1.8% | 4.3% | 0.0% | 1.1% | 3.6% | 2.5% | ||||||
| Colombia | 0.83 | -1.2% | 1.90 | +5.6% | 0.19 | +81.4% | 0.63 | +47.1% | 1.55 | +3.9% | 0.74 | -10.3% |
| Share % | 4.7% | 2.4% | 0.4% | 1.3% | 2.0% | 4.2% | ||||||
| Nigeria | 0.08 | -9.5% | 1.50 | +7.1% | 0.43 | +6.2% | 0.02 | 0.0% | 1.87 | +4.2% | 0.12 | +55.3% |
| Share % | 0.5% | 1.9% | 0.9% | 0.0% | 2.4% | 0.7% | ||||||
| Source: USDA, Last Update: 2024-04-12 | ||||||||||||
| Palm Oil - Balance sheet in Mio Tons | Year 2023-24 (Forecast Marzo) | ||||||||||||
|---|---|---|---|---|---|---|---|---|---|---|---|---|
| Country | Beginning Stocks | Production | Import | Export | Consumption | Ending Stocks | ||||||
| World | 17.52 | +6.7% | 79.46 | +1.8% | 47.27 | +0.7% | 49.42 | -0.2% | 77.61 | +4.5% | 17.22 | -2.3% |
| Indonesia | 6.64 | -9.1% | 47.00 | +1.1% | 0.00 | 0.0% | 27.70 | -1.3% | 20.35 | +6.6% | 5.59 | -15.8% |
| Share % | 37.9% | 59.1% | 0.0% | 56.1% | 26.2% | 32.5% | ||||||
| Malaysia | 2.31 | -0.2% | 19.00 | +3.3% | 1.00 | +7.0% | 15.80 | +2.9% | 4.17 | +5.0% | 2.34 | +1.3% |
| Share % | 13.2% | 23.9% | 2.1% | 32.0% | 5.4% | 13.6% | ||||||
| Thailand | 0.31 | -35.7% | 3.45 | +1.0% | 0.00 | 0.0% | 0.55 | -39.0% | 2.77 | +3.0% | 0.44 | +44.8% |
| Share % | 1.8% | 4.3% | 0.0% | 1.1% | 3.6% | 2.6% | ||||||
| Colombia | 0.83 | -1.2% | 1.90 | +5.6% | 0.19 | +81.4% | 0.63 | +47.1% | 1.55 | +3.9% | 0.74 | -10.3% |
| Share % | 4.7% | 2.4% | 0.4% | 1.3% | 2.0% | 4.3% | ||||||
| Nigeria | 0.08 | -9.5% | 1.50 | +7.1% | 0.43 | +6.2% | 0.02 | 0.0% | 1.87 | +4.2% | 0.12 | +55.3% |
| Share % | 0.5% | 1.9% | 0.9% | 0.0% | 2.4% | 0.7% | ||||||
| Source: USDA, Last Update: 2024-04-12 | ||||||||||||
| Palm Oil - Balance sheet in Mio Tons | Year 2022-23 | ||||||||||||
|---|---|---|---|---|---|---|---|---|---|---|---|---|
| Country | Beginning Stocks | Production | Import | Export | Consumption | Ending Stocks | ||||||
| World | 16.42 | +8.8% | 78.08 | +6.9% | 46.93 | +12.8% | 49.51 | +12.8% | 74.29 | +7.1% | 17.62 | +7.4% |
| Indonesia | 7.30 | +44.5% | 46.50 | +10.7% | 0.00 | 0.0% | 28.08 | +25.8% | 19.09 | +9.5% | 6.64 | -9.1% |
| Share % | 44.5% | 59.6% | 0.0% | 56.7% | 25.7% | 37.7% | ||||||
| Malaysia | 2.32 | +32.0% | 18.39 | +1.3% | 0.94 | -24.4% | 15.36 | -1.1% | 3.97 | +20.3% | 2.31 | -0.2% |
| Share % | 14.1% | 23.6% | 2.0% | 31.0% | 5.3% | 13.1% | ||||||
| Thailand | 0.48 | +17.8% | 3.42 | +1.2% | 0.00 | 0.0% | 0.90 | -7.1% | 2.69 | +15.0% | 0.31 | -35.7% |
| Share % | 2.9% | 4.4% | 0.0% | 1.8% | 3.6% | 1.8% | ||||||
| Colombia | 0.84 | +13.9% | 1.80 | +2.2% | 0.10 | -39.6% | 0.43 | -5.3% | 1.49 | +7.8% | 0.83 | -1.2% |
| Share % | 5.1% | 2.3% | 0.2% | 0.9% | 2.0% | 4.7% | ||||||
| Nigeria | 0.08 | -28.2% | 1.40 | 0.0% | 0.40 | +33.3% | 0.02 | 0.0% | 1.79 | +4.4% | 0.08 | -9.5% |
| Share % | 0.5% | 1.8% | 0.9% | 0.0% | 2.4% | 0.5% | ||||||
| Source: USDA, Last Update: 2024-04-12 | ||||||||||||
| Palm Kernel Oil - Balance sheet in Mio Tons | Year 2023-24 (Forecast April) | ||||||||||||
|---|---|---|---|---|---|---|---|---|---|---|---|---|
| Country | Beginning Stocks | Production | Import | Export | Consumption | Ending Stocks | ||||||
| World | 0.95 | -1.0% | 9.10 | +2.5% | 2.78 | +1.4% | 3.00 | +1.1% | 8.91 | +2.8% | 0.92 | -2.8% |
| Indonesia | 0.33 | -0.6% | 5.27 | +1.6% | 0.00 | 0.0% | 1.40 | -3.0% | 3.86 | +2.9% | 0.34 | +4.2% |
| Share % | 34.7% | 57.9% | 0.0% | 46.7% | 43.3% | 37.0% | ||||||
| Malaysia | 0.37 | +0.8% | 2.15 | +2.6% | 0.20 | -28.6% | 1.04 | +3.0% | 1.39 | +1.7% | 0.29 | -20.5% |
| Share % | 38.9% | 23.6% | 7.2% | 34.7% | 15.6% | 31.5% | ||||||
| Nigeria | 0.01 | -26.3% | 0.46 | +16.8% | 0.00 | 0.0% | 0.02 | +53.8% | 0.43 | +10.4% | 0.03 | +100.0% |
| Share % | 1.1% | 5.1% | 0.0% | 0.7% | 4.8% | 3.3% | ||||||
| Thailand | 0.06 | +13.7% | 0.40 | +1.5% | 0.02 | +200.0% | 0.15 | +34.3% | 0.27 | -5.4% | 0.06 | +1.7% |
| Share % | 6.3% | 4.4% | 0.7% | 5.0% | 3.0% | 6.5% | ||||||
| Colombia | 0.01 | -23.5% | 0.14 | +6.0% | 0.01 | -16.7% | 0.09 | +2.3% | 0.06 | 0.0% | 0.01 | +7.7% |
| Share % | 1.1% | 1.5% | 0.4% | 3.0% | 0.7% | 1.1% | ||||||
| Source: USDA, Last Update: 2024-04-12 | ||||||||||||
| Palm Kernel Oil - Balance sheet in Mio Tons | Year 2023-24 (Forecast Marzo) | ||||||||||||
|---|---|---|---|---|---|---|---|---|---|---|---|---|
| Country | Beginning Stocks | Production | Import | Export | Consumption | Ending Stocks | ||||||
| World | 0.95 | -0.7% | 9.10 | +2.5% | 2.89 | +5.3% | 3.04 | +2.5% | 8.97 | +3.5% | 0.93 | -1.6% |
| Indonesia | 0.33 | -0.6% | 5.27 | +1.6% | 0.00 | 0.0% | 1.40 | -3.0% | 3.86 | +2.9% | 0.34 | +4.2% |
| Share % | 34.7% | 57.9% | 0.0% | 46.1% | 43.0% | 36.6% | ||||||
| Malaysia | 0.37 | +1.4% | 2.15 | +2.6% | 0.20 | -28.6% | 1.10 | +8.9% | 1.33 | -2.7% | 0.29 | -19.9% |
| Share % | 38.9% | 23.6% | 6.9% | 36.2% | 14.8% | 31.2% | ||||||
| Nigeria | 0.01 | -26.3% | 0.46 | +16.8% | 0.00 | 0.0% | 0.02 | +53.8% | 0.43 | +10.4% | 0.03 | +100.0% |
| Share % | 1.1% | 5.1% | 0.0% | 0.7% | 4.8% | 3.2% | ||||||
| Thailand | 0.06 | +13.7% | 0.40 | +1.5% | 0.02 | +200.0% | 0.15 | +34.3% | 0.27 | -5.4% | 0.06 | +1.7% |
| Share % | 6.3% | 4.4% | 0.7% | 4.9% | 3.0% | 6.5% | ||||||
| Colombia | 0.01 | -23.5% | 0.14 | +6.0% | 0.01 | 0.0% | 0.08 | -9.1% | 0.06 | +10.9% | 0.02 | +46.2% |
| Share % | 1.1% | 1.5% | 0.3% | 2.6% | 0.7% | 2.2% | ||||||
| Source: USDA, Last Update: 2024-04-12 | ||||||||||||
| Palm Kernel Oil - Balance sheet in Mio Tons | Year 2022-23 | ||||||||||||
|---|---|---|---|---|---|---|---|---|---|---|---|---|
| Country | Beginning Stocks | Production | Import | Export | Consumption | Ending Stocks | ||||||
| World | 0.96 | -3.8% | 8.88 | +6.2% | 2.74 | +7.4% | 2.97 | +6.8% | 8.67 | +6.0% | 0.95 | -1.0% |
| Indonesia | 0.33 | -20.2% | 5.19 | +7.0% | 0.00 | 0.0% | 1.44 | +14.6% | 3.75 | +2.0% | 0.33 | -0.6% |
| Share % | 34.4% | 58.4% | 0.0% | 48.5% | 43.3% | 34.7% | ||||||
| Malaysia | 0.36 | +17.1% | 2.10 | +7.3% | 0.28 | -13.3% | 1.01 | -2.9% | 1.36 | +15.2% | 0.37 | +0.8% |
| Share % | 37.5% | 23.6% | 10.2% | 34.0% | 15.7% | 38.9% | ||||||
| Nigeria | 0.02 | +11.8% | 0.39 | 0.0% | 0.00 | 0.0% | 0.01 | 0.0% | 0.39 | +1.9% | 0.01 | -26.3% |
| Share % | 2.1% | 4.4% | 0.0% | 0.3% | 4.5% | 1.1% | ||||||
| Thailand | 0.05 | +112.5% | 0.39 | +4.8% | 0.01 | +∞ | 0.11 | -3.6% | 0.28 | +20.2% | 0.06 | +13.7% |
| Share % | 5.2% | 4.4% | 0.4% | 3.7% | 3.2% | 6.3% | ||||||
| Colombia | 0.02 | -10.5% | 0.13 | +3.9% | 0.01 | -25.0% | 0.09 | +14.3% | 0.06 | -9.8% | 0.01 | -23.5% |
| Share % | 2.1% | 1.5% | 0.4% | 3.0% | 0.7% | 1.1% | ||||||
| Source: USDA, Last Update: 2024-04-12 | ||||||||||||
| Peanut Oil - Balance sheet in Mio Tons | Year 2023-24 (Forecast April) | ||||||||||||
|---|---|---|---|---|---|---|---|---|---|---|---|---|
| Country | Beginning Stocks | Production | Import | Export | Consumption | Ending Stocks | ||||||
| World | 0.36 | +6.8% | 6.13 | -1.6% | 0.29 | -26.0% | 0.42 | +10.9% | 6.03 | -3.2% | 0.34 | -6.4% |
| China | 0.00 | 0.0% | 3.07 | -2.0% | 0.20 | -31.5% | 0.01 | 0.0% | 3.26 | -4.6% | 0.00 | 0.0% |
| Share % | 0.0% | 50.1% | 69.0% | 2.4% | 54.1% | 0.0% | ||||||
| India | 0.26 | +15.8% | 1.16 | -5.3% | 0.00 | 0.0% | 0.10 | -20.0% | 1.06 | 0.0% | 0.26 | -1.5% |
| Share % | 72.2% | 18.9% | 0.0% | 23.8% | 17.6% | 76.5% | ||||||
| Nigeria | 0.00 | 0.0% | 0.27 | 0.0% | 0.00 | 0.0% | 0.00 | 0.0% | 0.26 | 0.0% | 0.00 | 0.0% |
| Share % | 0.0% | 4.4% | 0.0% | 0.0% | 4.3% | 0.0% | ||||||
| Myanmar | 0.01 | 0.0% | 0.25 | +6.8% | 0.00 | 0.0% | 0.00 | 0.0% | 0.25 | +6.4% | 0.01 | +20.0% |
| Share % | 2.8% | 4.1% | 0.0% | 0.0% | 4.1% | 2.9% | ||||||
| Sudan | 0.02 | -40.0% | 0.22 | -12.6% | 0.00 | 0.0% | 0.01 | -64.3% | 0.22 | -12.0% | 0.01 | -20.0% |
| Share % | 5.6% | 3.6% | 0.0% | 2.4% | 3.6% | 2.9% | ||||||
| Source: USDA, Last Update: 2024-04-12 | ||||||||||||
| Peanut Oil - Balance sheet in Mio Tons | Year 2023-24 (Forecast Marzo) | ||||||||||||
|---|---|---|---|---|---|---|---|---|---|---|---|---|
| Country | Beginning Stocks | Production | Import | Export | Consumption | Ending Stocks | ||||||
| World | 0.37 | +10.4% | 6.14 | -1.5% | 0.30 | -23.7% | 0.42 | +11.4% | 6.04 | -3.0% | 0.35 | -2.2% |
| China | 0.00 | 0.0% | 3.07 | -2.0% | 0.20 | -31.5% | 0.01 | 0.0% | 3.26 | -4.6% | 0.00 | 0.0% |
| Share % | 0.0% | 50.0% | 66.7% | 2.4% | 54.0% | 0.0% | ||||||
| India | 0.26 | +15.8% | 1.16 | -5.3% | 0.00 | 0.0% | 0.10 | -20.0% | 1.06 | 0.0% | 0.26 | -1.5% |
| Share % | 70.3% | 18.9% | 0.0% | 23.8% | 17.5% | 74.3% | ||||||
| Nigeria | 0.00 | 0.0% | 0.27 | 0.0% | 0.00 | 0.0% | 0.00 | 0.0% | 0.26 | 0.0% | 0.00 | 0.0% |
| Share % | 0.0% | 4.4% | 0.0% | 0.0% | 4.3% | 0.0% | ||||||
| Myanmar | 0.01 | 0.0% | 0.25 | +6.8% | 0.00 | 0.0% | 0.00 | 0.0% | 0.25 | +6.4% | 0.01 | +20.0% |
| Share % | 2.7% | 4.1% | 0.0% | 0.0% | 4.1% | 2.9% | ||||||
| Sudan | 0.02 | -40.0% | 0.22 | -12.6% | 0.00 | 0.0% | 0.01 | -64.3% | 0.22 | -12.0% | 0.01 | -20.0% |
| Share % | 5.4% | 3.6% | 0.0% | 2.4% | 3.6% | 2.9% | ||||||
| Source: USDA, Last Update: 2024-04-12 | ||||||||||||
| Peanut Oil - Balance sheet in Mio Tons | Year 2022-23 | ||||||||||||
|---|---|---|---|---|---|---|---|---|---|---|---|---|
| Country | Beginning Stocks | Production | Import | Export | Consumption | Ending Stocks | ||||||
| World | 0.34 | +14.2% | 6.23 | -3.2% | 0.39 | +33.8% | 0.38 | +7.7% | 6.22 | -1.8% | 0.36 | +6.8% |
| China | 0.00 | 0.0% | 3.14 | -1.0% | 0.29 | +75.9% | 0.01 | -9.1% | 3.42 | +2.9% | 0.00 | 0.0% |
| Share % | 0.0% | 50.4% | 74.4% | 2.6% | 55.0% | 0.0% | ||||||
| India | 0.23 | +20.0% | 1.22 | -4.1% | 0.00 | 0.0% | 0.13 | +212.5% | 1.06 | -11.3% | 0.26 | +15.8% |
| Share % | 67.6% | 19.6% | 0.0% | 34.2% | 17.0% | 72.2% | ||||||
| Nigeria | 0.00 | 0.0% | 0.27 | 0.0% | 0.00 | 0.0% | 0.00 | 0.0% | 0.26 | 0.0% | 0.00 | 0.0% |
| Share % | 0.0% | 4.3% | 0.0% | 0.0% | 4.2% | 0.0% | ||||||
| Myanmar | 0.01 | -58.3% | 0.24 | -13.9% | 0.00 | 0.0% | 0.00 | 0.0% | 0.24 | -16.1% | 0.01 | 0.0% |
| Share % | 2.9% | 3.9% | 0.0% | 0.0% | 3.9% | 2.8% | ||||||
| Sudan | 0.03 | -16.7% | 0.25 | -5.9% | 0.00 | 0.0% | 0.01 | +180.0% | 0.25 | -7.4% | 0.02 | -40.0% |
| Share % | 8.8% | 4.0% | 0.0% | 2.6% | 4.0% | 5.6% | ||||||
| Source: USDA, Last Update: 2024-04-12 | ||||||||||||
| Rapeseed Oil - Balance sheet in Mio Tons | Year 2023-24 (Forecast April) | ||||||||||||
|---|---|---|---|---|---|---|---|---|---|---|---|---|
| Country | Beginning Stocks | Production | Import | Export | Consumption | Ending Stocks | ||||||
| World | 3.07 | +17.1% | 34.01 | +3.9% | 7.51 | +8.9% | 7.69 | +18.0% | 33.58 | +2.8% | 3.32 | +8.2% |
| EU-27 | 0.34 | -8.0% | 10.25 | +0.8% | 0.38 | -6.7% | 0.73 | +8.0% | 9.90 | -0.3% | 0.34 | -0.6% |
| Share % | 11.1% | 30.1% | 5.1% | 9.5% | 29.5% | 10.2% | ||||||
| China | 1.15 | +36.7% | 7.29 | +1.1% | 2.00 | +0.1% | 0.00 | -25.0% | 9.00 | +1.1% | 1.44 | +25.2% |
| Share % | 37.5% | 21.4% | 26.6% | 0.0% | 26.8% | 43.4% | ||||||
| Canada | 0.63 | +20.2% | 4.67 | +12.5% | 0.02 | -23.1% | 3.75 | +24.3% | 1.05 | -0.5% | 0.52 | -17.4% |
| Share % | 20.5% | 13.7% | 0.3% | 48.8% | 3.1% | 15.7% | ||||||
| India | 0.40 | +62.8% | 4.15 | +8.0% | 0.01 | -16.7% | 0.01 | -9.1% | 4.08 | +10.9% | 0.46 | +15.2% |
| Share % | 13.0% | 12.2% | 0.1% | 0.1% | 12.2% | 13.9% | ||||||
| Russia | 0.04 | -59.6% | 1.33 | +11.4% | 0.15 | -6.3% | 1.33 | +3.9% | 0.14 | 0.0% | 0.06 | +25.0% |
| Share % | 1.3% | 3.9% | 2.0% | 17.3% | 0.4% | 1.8% | ||||||
| Source: USDA, Last Update: 2024-04-12 | ||||||||||||
| Rapeseed Oil - Balance sheet in Mio Tons | Year 2023-24 (Forecast Marzo) | ||||||||||||
|---|---|---|---|---|---|---|---|---|---|---|---|---|
| Country | Beginning Stocks | Production | Import | Export | Consumption | Ending Stocks | ||||||
| World | 3.19 | +21.9% | 33.79 | +3.3% | 7.41 | +7.5% | 7.55 | +15.8% | 33.46 | +2.5% | 3.38 | +10.3% |
| EU-27 | 0.41 | +8.8% | 10.25 | +0.8% | 0.38 | -6.7% | 0.73 | +8.0% | 9.90 | -0.3% | 0.40 | +17.8% |
| Share % | 12.9% | 30.3% | 5.1% | 9.7% | 29.6% | 11.8% | ||||||
| China | 1.15 | +36.7% | 7.29 | +1.1% | 2.00 | +0.1% | 0.00 | -25.0% | 9.00 | +1.1% | 1.44 | +25.2% |
| Share % | 36.1% | 21.6% | 27.0% | 0.0% | 26.9% | 42.6% | ||||||
| Canada | 0.63 | +20.0% | 4.50 | +8.4% | 0.02 | -23.1% | 3.60 | +19.4% | 1.06 | 0.0% | 0.50 | -21.6% |
| Share % | 19.7% | 13.3% | 0.3% | 47.7% | 3.2% | 14.8% | ||||||
| India | 0.40 | +62.8% | 4.15 | +8.0% | 0.01 | -16.7% | 0.01 | -9.1% | 4.08 | +10.9% | 0.46 | +15.2% |
| Share % | 12.5% | 12.3% | 0.1% | 0.1% | 12.2% | 13.6% | ||||||
| Russia | 0.02 | -78.0% | 1.33 | +11.4% | 0.15 | -6.3% | 1.33 | +3.9% | 0.15 | +7.1% | 0.03 | -43.2% |
| Share % | 0.6% | 3.9% | 2.0% | 17.6% | 0.4% | 0.9% | ||||||
| Source: USDA, Last Update: 2024-04-12 | ||||||||||||
| Rapeseed Oil - Balance sheet in Mio Tons | Year 2022-23 | ||||||||||||
|---|---|---|---|---|---|---|---|---|---|---|---|---|
| Country | Beginning Stocks | Production | Import | Export | Consumption | Ending Stocks | ||||||
| World | 2.62 | -28.7% | 32.72 | +12.2% | 6.89 | +34.4% | 6.52 | +25.2% | 32.65 | +8.3% | 3.07 | +17.1% |
| EU-27 | 0.37 | +76.8% | 10.16 | +11.0% | 0.40 | -32.2% | 0.67 | +99.1% | 9.93 | +7.3% | 0.34 | -8.0% |
| Share % | 14.1% | 31.1% | 5.8% | 10.3% | 30.4% | 11.1% | ||||||
| China | 0.84 | -56.6% | 7.22 | +12.1% | 2.00 | +105.3% | 0.00 | +33.3% | 8.90 | +4.7% | 1.15 | +36.7% |
| Share % | 32.1% | 22.1% | 29.0% | 0.0% | 27.3% | 37.5% | ||||||
| Canada | 0.53 | -2.1% | 4.15 | +16.2% | 0.03 | +36.8% | 3.02 | +17.2% | 1.06 | +2.4% | 0.63 | +20.2% |
| Share % | 20.2% | 12.7% | 0.4% | 46.3% | 3.2% | 20.5% | ||||||
| India | 0.25 | -16.3% | 3.84 | +3.6% | 0.01 | -82.4% | 0.01 | +57.1% | 3.68 | -2.6% | 0.40 | +62.8% |
| Share % | 9.5% | 11.7% | 0.1% | 0.2% | 11.3% | 13.0% | ||||||
| Russia | 0.11 | +303.7% | 1.19 | +32.7% | 0.16 | 0.0% | 1.28 | +51.8% | 0.14 | +3.7% | 0.04 | -59.6% |
| Share % | 4.2% | 3.6% | 2.3% | 19.6% | 0.4% | 1.3% | ||||||
| Source: USDA, Last Update: 2024-04-12 | ||||||||||||
| Rapeseed Oil - Balance sheet in Mio Tons | Year 2023-24 (Forecast April) | ||||||||||||
|---|---|---|---|---|---|---|---|---|---|---|---|---|
| Country | Beginning Stocks | Production | Import | Export | Consumption | Ending Stocks | ||||||
| World | 4.89 | +5.5% | 61.63 | +4.0% | 10.72 | -1.9% | 11.41 | -2.0% | 60.67 | +4.1% | 5.16 | +5.5% |
| China | 0.87 | +125.8% | 17.56 | +2.1% | 0.40 | +1.3% | 0.20 | +80.2% | 17.80 | +4.7% | 0.84 | -4.3% |
| Share % | 17.8% | 28.5% | 3.7% | 1.8% | 29.3% | 16.3% | ||||||
| United States | 0.73 | -19.3% | 12.28 | +3.2% | 0.23 | +33.5% | 0.16 | -7.0% | 12.34 | +2.2% | 0.74 | +1.2% |
| Share % | 14.9% | 19.9% | 2.1% | 1.4% | 20.3% | 14.3% | ||||||
| Brazil | 0.30 | -26.2% | 10.21 | -0.2% | 0.03 | +3.4% | 1.75 | -34.8% | 8.43 | +9.8% | 0.36 | +21.1% |
| Share % | 6.1% | 16.6% | 0.3% | 15.3% | 13.9% | 7.0% | ||||||
| Argentina | 0.33 | -37.5% | 7.01 | +17.0% | 0.00 | 0.0% | 4.80 | +16.0% | 2.25 | +9.8% | 0.29 | -11.9% |
| Share % | 6.7% | 11.4% | 0.0% | 42.1% | 3.7% | 5.6% | ||||||
| EU-27 | 0.56 | +2.4% | 2.83 | +4.2% | 0.50 | -19.7% | 0.80 | -13.2% | 2.46 | +2.1% | 0.64 | +13.5% |
| Share % | 11.5% | 4.6% | 4.7% | 7.0% | 4.1% | 12.4% | ||||||
| Source: USDA, Last Update: 2024-04-12 | ||||||||||||
| Rapeseed Oil - Balance sheet in Mio Tons | Year 2023-24 (Forecast Marzo) | ||||||||||||
|---|---|---|---|---|---|---|---|---|---|---|---|---|
| Country | Beginning Stocks | Production | Import | Export | Consumption | Ending Stocks | ||||||
| World | 4.91 | +6.0% | 61.68 | +4.1% | 10.78 | -1.4% | 11.50 | -1.2% | 60.86 | +4.4% | 5.01 | +2.6% |
| China | 0.87 | +125.8% | 17.56 | +2.1% | 0.40 | +1.3% | 0.20 | +80.2% | 17.80 | +4.7% | 0.84 | -4.3% |
| Share % | 17.7% | 28.5% | 3.7% | 1.7% | 29.2% | 16.8% | ||||||
| United States | 0.73 | -19.3% | 12.26 | +3.0% | 0.20 | +20.0% | 0.14 | -20.5% | 12.34 | +2.2% | 0.72 | -1.5% |
| Share % | 14.9% | 19.9% | 1.9% | 1.2% | 20.3% | 14.4% | ||||||
| Brazil | 0.30 | -26.2% | 10.21 | -0.2% | 0.03 | -13.8% | 1.75 | -34.8% | 8.43 | +9.8% | 0.36 | +19.4% |
| Share % | 6.1% | 16.6% | 0.3% | 15.2% | 13.9% | 7.2% | ||||||
| Argentina | 0.33 | -37.5% | 7.01 | +17.0% | 0.00 | 0.0% | 4.80 | +16.0% | 2.25 | +9.8% | 0.29 | -11.9% |
| Share % | 6.7% | 11.4% | 0.0% | 41.7% | 3.7% | 5.8% | ||||||
| EU-27 | 0.61 | +11.5% | 2.83 | +4.2% | 0.40 | -35.8% | 0.90 | -2.4% | 2.51 | +4.2% | 0.44 | -22.0% |
| Share % | 12.4% | 4.6% | 3.7% | 7.8% | 4.1% | 8.8% | ||||||
| Source: USDA, Last Update: 2024-04-12 | ||||||||||||
| Rapeseed Oil - Balance sheet in Mio Tons | Year 2022-23 | ||||||||||||
|---|---|---|---|---|---|---|---|---|---|---|---|---|
| Country | Beginning Stocks | Production | Import | Export | Consumption | Ending Stocks | ||||||
| World | 4.63 | -15.8% | 59.24 | -0.6% | 10.93 | -3.7% | 11.65 | -5.5% | 58.28 | -2.1% | 4.89 | +5.5% |
| China | 0.39 | -67.2% | 17.20 | +6.7% | 0.40 | +35.7% | 0.11 | -0.9% | 17.00 | -0.6% | 0.87 | +125.8% |
| Share % | 8.4% | 29.0% | 3.7% | 0.9% | 29.2% | 17.8% | ||||||
| United States | 0.90 | -6.6% | 11.90 | +0.3% | 0.17 | +24.1% | 0.17 | -78.7% | 12.07 | +7.2% | 0.73 | -19.3% |
| Share % | 19.4% | 20.1% | 1.6% | 1.5% | 20.7% | 14.9% | ||||||
| Brazil | 0.41 | -13.8% | 10.23 | +4.8% | 0.03 | -9.4% | 2.69 | +11.5% | 7.68 | +3.0% | 0.30 | -26.2% |
| Share % | 8.9% | 17.3% | 0.3% | 23.1% | 13.2% | 6.1% | ||||||
| Argentina | 0.52 | +74.9% | 5.99 | -21.8% | 0.00 | -100.0% | 4.14 | -15.1% | 2.05 | -22.9% | 0.33 | -37.5% |
| Share % | 11.2% | 10.1% | 0.0% | 35.5% | 3.5% | 6.7% | ||||||
| EU-27 | 0.55 | +25.0% | 2.72 | -7.1% | 0.62 | +35.7% | 0.92 | -4.9% | 2.41 | +4.3% | 0.56 | +2.4% |
| Share % | 11.9% | 4.6% | 5.7% | 7.9% | 4.1% | 11.5% | ||||||
| Source: USDA, Last Update: 2024-04-12 | ||||||||||||
| Sunflowerseed Oil - Balance sheet in Mio Tons | Year 2023-24 (Forecast April) | ||||||||||||
|---|---|---|---|---|---|---|---|---|---|---|---|---|
| Country | Beginning Stocks | Production | Import | Export | Consumption | Ending Stocks | ||||||
| World | 2.96 | +14.7% | 21.80 | +0.6% | 12.74 | +0.9% | 14.46 | +1.3% | 20.65 | +5.2% | 2.38 | -19.5% |
| Russia | 0.35 | +21.0% | 6.82 | +5.1% | 0.00 | 0.0% | 4.40 | +10.0% | 2.53 | +4.1% | 0.24 | -31.5% |
| Share % | 11.8% | 31.3% | 0.0% | 30.4% | 12.3% | 10.1% | ||||||
| Ukraine | 0.03 | -71.3% | 6.32 | +5.0% | 0.00 | -100.0% | 5.90 | +3.8% | 0.42 | +3.7% | 0.03 | +7.4% |
| Share % | 1.0% | 29.0% | 0.0% | 40.8% | 2.0% | 1.3% | ||||||
| EU-27 | 0.33 | -49.1% | 3.89 | -3.2% | 2.45 | +16.5% | 0.90 | -26.3% | 5.41 | +3.8% | 0.35 | +7.3% |
| Share % | 11.1% | 17.8% | 19.2% | 6.2% | 26.2% | 14.7% | ||||||
| Argentina | 0.27 | -6.0% | 1.63 | -3.8% | 0.00 | 0.0% | 1.00 | -4.8% | 0.68 | +3.0% | 0.21 | -19.6% |
| Share % | 9.1% | 7.5% | 0.0% | 6.9% | 3.3% | 8.8% | ||||||
| Turkey | 0.58 | +161.3% | 0.83 | -22.3% | 1.23 | -28.4% | 1.10 | -0.2% | 1.39 | +5.7% | 0.14 | -75.5% |
| Share % | 19.6% | 3.8% | 9.7% | 7.6% | 6.7% | 5.9% | ||||||
| Source: USDA, Last Update: 2024-04-12 | ||||||||||||
| Sunflowerseed Oil - Balance sheet in Mio Tons | Year 2023-24 (Forecast Marzo) | ||||||||||||
|---|---|---|---|---|---|---|---|---|---|---|---|---|
| Country | Beginning Stocks | Production | Import | Export | Consumption | Ending Stocks | ||||||
| World | 2.90 | +12.6% | 21.66 | +0.0% | 12.25 | -2.9% | 14.02 | -1.8% | 20.28 | +3.3% | 2.52 | -14.8% |
| Russia | 0.25 | -14.0% | 6.82 | +5.1% | 0.00 | 0.0% | 4.30 | +7.5% | 2.53 | +4.1% | 0.24 | -31.5% |
| Share % | 8.6% | 31.5% | 0.0% | 30.7% | 12.5% | 9.5% | ||||||
| Ukraine | 0.04 | -55.3% | 6.11 | +1.4% | 0.00 | -100.0% | 5.75 | +1.2% | 0.37 | -9.9% | 0.03 | +25.9% |
| Share % | 1.4% | 28.2% | 0.0% | 41.0% | 1.8% | 1.2% | ||||||
| EU-27 | 0.29 | -54.7% | 3.85 | -4.2% | 2.35 | +11.7% | 0.80 | -34.5% | 5.36 | +2.9% | 0.32 | -1.2% |
| Share % | 10.0% | 17.8% | 19.2% | 5.7% | 26.4% | 12.7% | ||||||
| Argentina | 0.27 | -6.0% | 1.63 | -3.8% | 0.00 | 0.0% | 0.95 | -9.5% | 0.68 | +3.0% | 0.26 | -0.8% |
| Share % | 9.3% | 7.5% | 0.0% | 6.8% | 3.4% | 10.3% | ||||||
| Turkey | 0.56 | +150.0% | 0.93 | -12.8% | 1.23 | -28.4% | 1.13 | +2.1% | 1.42 | +7.6% | 0.17 | -71.0% |
| Share % | 19.3% | 4.3% | 10.0% | 8.1% | 7.0% | 6.7% | ||||||
| Source: USDA, Last Update: 2024-04-12 | ||||||||||||
| Sunflowerseed Oil - Balance sheet in Mio Tons | Year 2022-23 | ||||||||||||
|---|---|---|---|---|---|---|---|---|---|---|---|---|
| Country | Beginning Stocks | Production | Import | Export | Consumption | Ending Stocks | ||||||
| World | 2.58 | +29.0% | 21.66 | +10.2% | 12.62 | +30.4% | 14.27 | +27.2% | 19.63 | +12.0% | 2.96 | +14.7% |
| Russia | 0.29 | +439.6% | 6.48 | +12.1% | 0.00 | 0.0% | 4.00 | +23.1% | 2.43 | +5.4% | 0.35 | +21.0% |
| Share % | 11.2% | 29.9% | 0.0% | 28.0% | 12.4% | 11.8% | ||||||
| Ukraine | 0.09 | -66.3% | 6.02 | +29.6% | 0.00 | 0.0% | 5.68 | +27.3% | 0.41 | +11.0% | 0.03 | -71.3% |
| Share % | 3.5% | 27.8% | 0.0% | 39.8% | 2.1% | 1.0% | ||||||
| EU-27 | 0.65 | +205.7% | 4.01 | -8.6% | 2.10 | -3.4% | 1.22 | +43.6% | 5.21 | -1.4% | 0.33 | -49.1% |
| Share % | 25.2% | 18.5% | 16.6% | 8.5% | 26.5% | 11.1% | ||||||
| Argentina | 0.28 | +20.5% | 1.70 | +12.8% | 0.00 | 0.0% | 1.05 | +20.3% | 0.66 | +13.7% | 0.27 | -6.0% |
| Share % | 10.9% | 7.8% | 0.0% | 7.4% | 3.4% | 9.1% | ||||||
| Turkey | 0.22 | +58.6% | 1.06 | +15.3% | 1.71 | +30.8% | 1.10 | +24.0% | 1.32 | +4.4% | 0.58 | +161.3% |
| Share % | 8.5% | 4.9% | 13.5% | 7.7% | 6.7% | 19.6% | ||||||
| Source: USDA, Last Update: 2024-04-12 | ||||||||||||
Show the data of:
Previous season
Current season
Show the data of:
Previous season
Current season
Show the data of:
Previous season
Current season
Show the data of:
Previous season
Current season
Show the data of:
Previous season
Current season
| Previous forecast
| Current forecast
| Oranges - Balance sheet in Million Tons | Year 2021-22 (Forecast March) | |||||||||||
|---|---|---|---|---|---|---|---|---|---|---|---|
| Country | Production | Prod. for Processing | Import | Export | Fresh Consumption | ||||||
| World |
Login to consult this balance
The login can be done from the bar at the top of the page, by clicking on "Login" on the right, next to the flags. Don't Have an Account? Click here to sign up. |
||||||||||
| Brazil | |||||||||||
| China | |||||||||||
| EU-27 | |||||||||||
| Mexico | |||||||||||
| United States | |||||||||||
| Source: USDA, Last Update: 2022-03-17 | |||||||||||
| Apples - Balance sheet in Million Tons | Year 2021-22 (Forecast March) | |||||||||
|---|---|---|---|---|---|---|---|---|---|
| Country | Production | Import | Export | Consumption | |||||
| World |
Login to consult this balance
The login can be done from the bar at the top of the page, by clicking on "Login" on the right, next to the flags. Don't Have an Account? Click here to sign up. |
||||||||
| China | |||||||||
| EU-27 | |||||||||
| United States | |||||||||
| Turkey | |||||||||
| India | |||||||||
| Source: USDA, Last Update: 2022-03-17 | |||||||||
| Pears - Balance sheet in Million Tons | Year 2021-22 (Forecast March) | |||||||||
|---|---|---|---|---|---|---|---|---|---|
| Country | Production | Import | Export | Consumption | |||||
| World |
Login to consult this balance
The login can be done from the bar at the top of the page, by clicking on "Login" on the right, next to the flags. Don't Have an Account? Click here to sign up. |
||||||||
| China | |||||||||
| EU-27 | |||||||||
| United States | |||||||||
| Argentina | |||||||||
| Turkey | |||||||||
| Source: USDA, Last Update: 2022-03-17 | |||||||||
| Lemons - Balance sheet in Million Tons | Year 2021-22 (Forecast March) | |||||||||||
|---|---|---|---|---|---|---|---|---|---|---|---|
| Country | Production | Prod. for Processing | Import | Export | Fresh Consumption | ||||||
| World |
Login to consult this balance
The login can be done from the bar at the top of the page, by clicking on "Login" on the right, next to the flags. Don't Have an Account? Click here to sign up. |
||||||||||
| Mexico | |||||||||||
| Argentina | |||||||||||
| EU-27 | |||||||||||
| Turkey | |||||||||||
| United States | |||||||||||
| Source: USDA, Last Update: 2022-03-17 | |||||||||||
| Peaches and Nectarines - Balance sheet in Million Tons | Year 2021-22 (Forecast March) | |||||||||
|---|---|---|---|---|---|---|---|---|---|
| Country | Production | Import | Export | Consumption | |||||
| World |
Login to consult this balance
The login can be done from the bar at the top of the page, by clicking on "Login" on the right, next to the flags. Don't Have an Account? Click here to sign up. |
||||||||
| China | |||||||||
| EU-27 | |||||||||
| Turkey | |||||||||
| United States | |||||||||
| Argentina | |||||||||
| Source: USDA, Last Update: 2022-03-17 | |||||||||
Show the data of:
Annata precedente
Current season
| Previous forecast
| Current forecast
| Sugar - Balance sheet in Mio Tons | Year 2023 (Forecast November) | |||||||||||||||
|---|---|---|---|---|---|---|---|---|---|---|---|---|---|---|---|
| Country | Beginning Stocks | Production (Beet) | Production (Cane) | Import | Export | Human Consumption | Ending Stocks | ||||||||
| World |
Login to consult this balance
The login can be done from the bar at the top of the page, by clicking on "Login" on the right, next to the flags. Don't Have an Account? Click here to sign up. |
||||||||||||||
| Brazil | |||||||||||||||
| India | |||||||||||||||
| EU-27 | |||||||||||||||
| China | |||||||||||||||
| Thailand | |||||||||||||||
| Source: USDA, Last Update: 2023-11-22 | |||||||||||||||
TESEO by CLAL.itenter
TESEO is the new web platform developed by the CLAL Team.
TESEO analyzes the agricultural market and provides data, news and synthesis thanks to information and training activities.
Compare your
performanceenter

Registrati al network CLAL.itregistrati
Registration is free and allows you to receive information and updates via e-mail regarding new web pages, news from the dairy and agricultural world.
Registrati »
for a continuous update
TESEO is supported by:
Agricultural Market Feed
| IT, Milan: Italian Soybeans flour price | Increased | 490 | €/ton | +5,38% |
| IT, Milan: Italian higher common wheat price | Decreased | 267 | €/ton | -0,37% |
| IT, Milan: Foreign soybeans price | Increased | 468 | €/ton | +0,65% |
| IT, Milan: Italian soybeans price | Increased | 470 | €/ton | +1,08% |
| IT, Milan: Bran price | Increased | 129 | €/ton | +1,57% |
| IT, Foggia: durum wheat - mercantile price | Decreased | 352 | €/ton | -7,86% |
| IT, Foggia: durum wheat - buono mercantile price | Decreased | 352 | €/ton | -7,86% |
| IT, Foggia: durum wheat - fino price | Decreased | 363 | €/ton | -7,64% |
| IT, Bologna: Barley - s.w. 65 and over | Increased | 246 | €/ton | +2,08% |
| IT, Bologna: Barley - s.w. 62/64 price | Increased | 238 | €/ton | +2,15% |
| IT, Bologna: Sorghum - Italian white price | Decreased | 283 | €/ton | -1,74% |
| IT, Bologna: Corn - Italian for livestock (with characteristics) price | Decreased | 291 | €/ton | -1,69% |
- Market News evidences only the changes; should no price change or no quotation take place, any mention will be made.
- The change/variation concerning PRODUCTION/OUTPUT quantity refers to the same period of the previous year.
- The change/variation concerning STOCK quantity refers to the previous month.
- The change/variation of price refers to PRICES expressed in local currency (for both EU and the World). The change refers to the previous week/month/year, as the case may be. In the case of dual-listed (min and max), changes are calculated using the MAX PRICE.
Fertilizer Prices
| IT, Turin - Triple superphosphate 46% | In calo | 545 | €/ton |
| IT, Turin - Ammonium nitrate 26% | In calo | 315 | €/ton |
| IT, Turin - Urea 46% | In calo | 400 | €/ton |
Feed Cost
| Weight of the Protein Component | 49% |
| Simulated Feed Ration (vs prev month) | -1.03% |
| Milk:Feed Ratio | 1.68 |