|
|
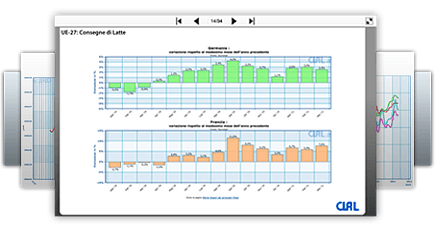
This page contains two graphs:
- one comparing the price of Farm-gate Milk in New Zealand, the US and Lombardy, (the largest milk-producing region in Italian production) over a given time period;
- one comparing the price of Farm-gate Milk in New Zealand, US and Germany over a given time period.
|
|
N.B.:
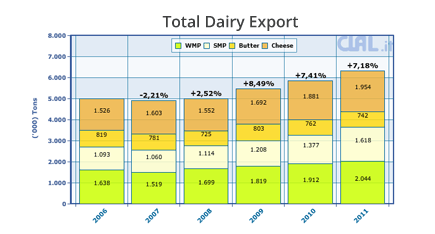
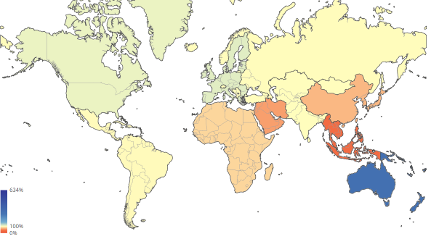
New Zealand exports approximately 85% of its milk production, which is processed into cheddar-type cheeses, milk powders and butter.
New Zealand exports standard products that are mainly linked to mass consumption or industrial use.
The main difference between New Zealand's production (which is comparable to US production) and Lombard production lies in the quality of end use, which is reflected by the different milk prices. Lombard milk production is mostly processed into P.D.O. (Protected Designation of Origin) products.
|
|
|
|
|
|
| |
Farmgate milk price
Lombardy (Italy) * (€/100 kg.) |
|
Month
|
2024 |
2025 |
2026 |
± on prev.
month. |
± % from
2025 |
| January |
48,50 |
57,23 |
(e)48,98 |
-9,01% |
-14,41% |
| February |
48,50 |
58,20 |
(e)48,50 |
-0,99% |
-16,67% |
| March |
48,98 |
58,20 |
|
|
|
| April |
49,95 |
58,20 |
|
|
|
| May |
49,95 |
58,20 |
|
|
|
| June |
50,92 |
58,20 |
|
|
|
| July |
51,89 |
58,20 |
|
|
|
| August |
52,38 |
58,20 |
|
|
|
| September |
52,86 |
57,71 |
|
|
|
| October |
53,35 |
56,26 |
|
|
|
| November |
54,32 |
55,29 |
|
|
|
| December |
55,77 |
53,83 |
|
|
|
| Jan-Feb |
48,50 |
57,71 |
48,74 |
| Change¹ % |
-14,89% |
+19,00% |
-15,55% |
| Average |
51,45 |
57,31 |
| Change¹ % |
+0,47% |
+11,39% |
Last Update:15-03-2026
1) change from the same period of previous year
The monthly, cumulative and annual prices are arithmetic averages calculated on the basis of the weekly prices
*: Approx. average fat 3,7% p.v. ; Prot 3,25% p.v.
(e) = estimated price
Source: Processed by CLAL |
| |
min price |
| |
max price |
|
|
Farmgate milk price
Germany * (€/100 kg.) |
|
Month
|
2024 |
2025 |
2026 |
± on prev.
month. |
± % from
2025 |
| January |
44,07 |
52,67 |
39,43 |
-9,25% |
-25,14% |
| February |
44,33 |
52,56 |
|
|
|
| March |
44,79 |
52,77 |
|
|
|
| April |
44,91 |
53,02 |
|
|
|
| May |
45,19 |
53,37 |
|
|
|
| June |
45,64 |
53,31 |
|
|
|
| July |
46,41 |
53,37 |
|
|
|
| August |
47,42 |
53,51 |
|
|
|
| September |
48,83 |
52,57 |
|
|
|
| October |
50,99 |
49,94 |
|
|
|
| November |
52,53 |
46,50 |
|
|
|
| December |
53,53 |
43,45 |
|
|
|
| Jan |
44,07 |
52,67 |
39,43 |
| Change¹ % |
-22,59% |
+19,51% |
-25,14% |
| Average |
47,39 |
51,42 |
| Change¹ % |
+6,16% |
+8,51% |
Last Update:16-03-2026
1) change from the same period of previous year
The monthly, cumulative and annual prices are arithmetic averages calculated on the basis of the weekly prices
*: Approx. average fat 3,7% p.v. ; Prot 3,25% p.v.3,7% fat - 3,40% proteins
Since January 2010 Fat content, to which farm-gate milk price refers, has increased from 3,70 % to 4,00 %.
Source: Processed by CLAL |
| |
min price |
| |
max price |
|
|
Farmgate milk price
USA * (€/100 kg.) |
|
Month
|
2024 |
2025 |
2026 |
± on prev.
month. |
± % from
2025 |
| January |
40,23 |
51,32 |
32,87 |
-8,13% |
-35,95% |
| February |
41,66 |
49,97 |
(e)34,12 |
+3,81% |
-31,71% |
| March |
41,77 |
44,88 |
|
|
|
| April |
41,92 |
41,29 |
|
|
|
| May |
44,86 |
41,64 |
|
|
|
| June |
46,72 |
40,78 |
|
|
|
| July |
46,35 |
39,27 |
|
|
|
| August |
47,18 |
39,61 |
|
|
|
| September |
50,62 |
38,33 |
|
|
|
| October |
50,75 |
37,91 |
|
|
|
| November |
50,19 |
37,57 |
|
|
|
| December |
49,02 |
35,78 |
|
|
|
| Jan-Feb |
40,95 |
50,64 |
33,49 |
| Change¹ % |
-9,92% |
+23,68% |
-33,86% |
| Average |
45,94 |
41,53 |
| Change¹ % |
+10,72% |
-9,60% |
Last Update:31-03-2026
1) change from the same period of previous year
The monthly, cumulative and annual prices are arithmetic averages calculated on the basis of the weekly prices
*: Approx. average fat 3,7% p.p. avg.
(e) = estimated price
Source: Processed by CLAL |
| |
min price |
| |
max price |
|
|
Farmgate milk price
Nuova Zelanda * (€/100 kg.) |
|
Month
|
2024 |
2025 |
2026 |
± on prev.
month. |
± % from
2025 |
| January |
33,54 |
41,32 |
35,94 |
+6,71% |
-13,02% |
| February |
33,65 |
41,45 |
|
|
|
| March |
33,17 |
40,26 |
|
|
|
| April |
32,95 |
39,47 |
|
|
|
| May |
33,27 |
40,00 |
|
|
|
| June |
34,67 |
39,76 |
|
|
|
| July |
35,92 |
39,03 |
|
|
|
| August |
37,77 |
38,54 |
|
|
|
| September |
38,33 |
38,11 |
|
|
|
| October |
40,30 |
35,75 |
|
|
|
| November |
42,30 |
33,47 |
|
|
|
| December |
41,72 |
33,68 |
|
|
|
| Jan |
33,54 |
41,32 |
35,94 |
| Change¹ % |
-12,52% |
+23,20% |
-13,02% |
| Average |
36,47 |
38,40 |
| Change¹ % |
+9,21% |
+5,31% |
Last Update:10-03-2026
1) change from the same period of previous year
The monthly, cumulative and annual prices are arithmetic averages calculated on the basis of the weekly prices
*: Approx. average fat 4,7% p.p. avg. ; Prot. 3,35% p.p. avg.
Source: UK-Milk Development Council |
| |
min price |
| |
max price |
|
|
|


.jpg)


.jpg)


 enter
enter
 enter
enter
 enter
enter
 subscribe