


Italy: Performance and Competitiveness of Italian Dairy Farms FARM S/STEM
Il progetto S/STEMA STALLA ha l'obiettivo di misurare la competitività delle Aziende agricole da latte bovino italiane. Il Team di CLAL ha selezionato alcuni Allevatori del nord Italia particolarmente attenti a performance e costi, e li ha incontrati presso le loro stalle per comprendere il funzionamento e rilevare i dati dell'azienda agricola.


Dairy Farms in the project
Il paniere di Aziende monitorate non sono un campione delle aziende italiane, ma una selezione di aziende
particolarmente attente a performance e costi.
I dati visualizzati sono riferiti all'anno solare 2012.
Al progetto partecipano 16 Aziende del nord Italia, individuate nella mappa sottostante con il loro patrimonio bovino.
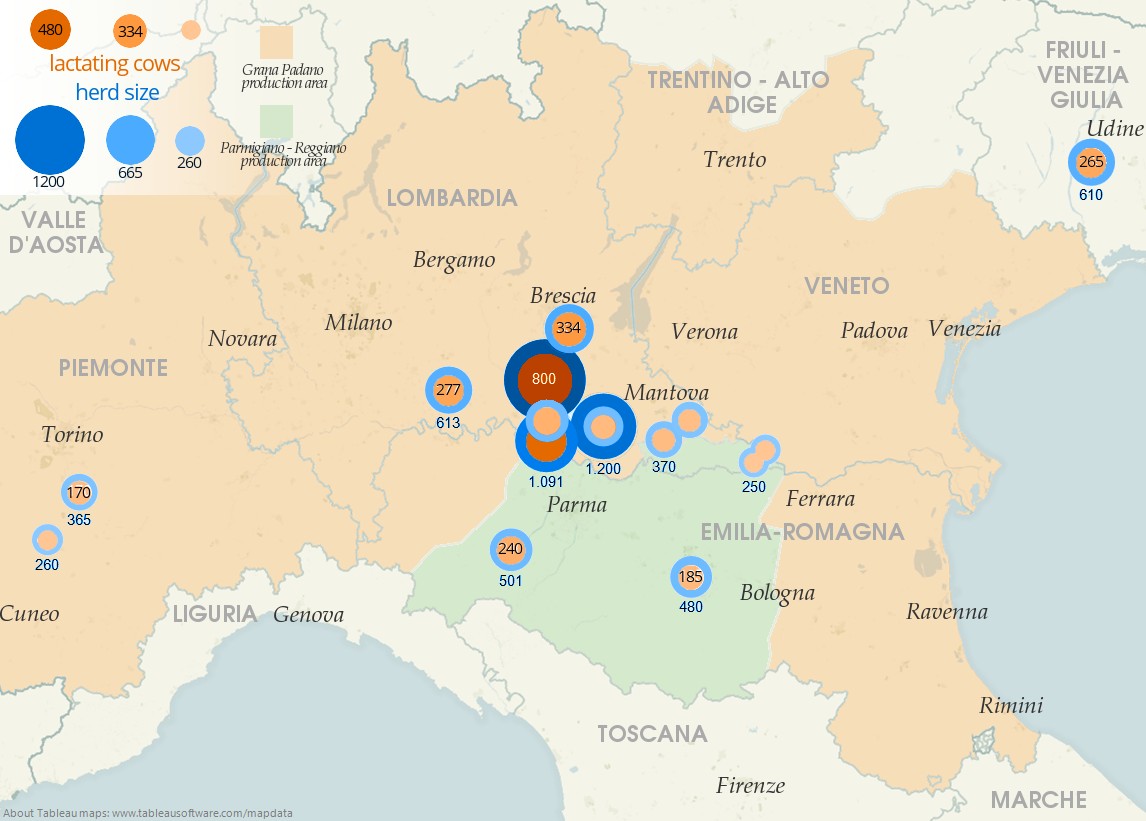
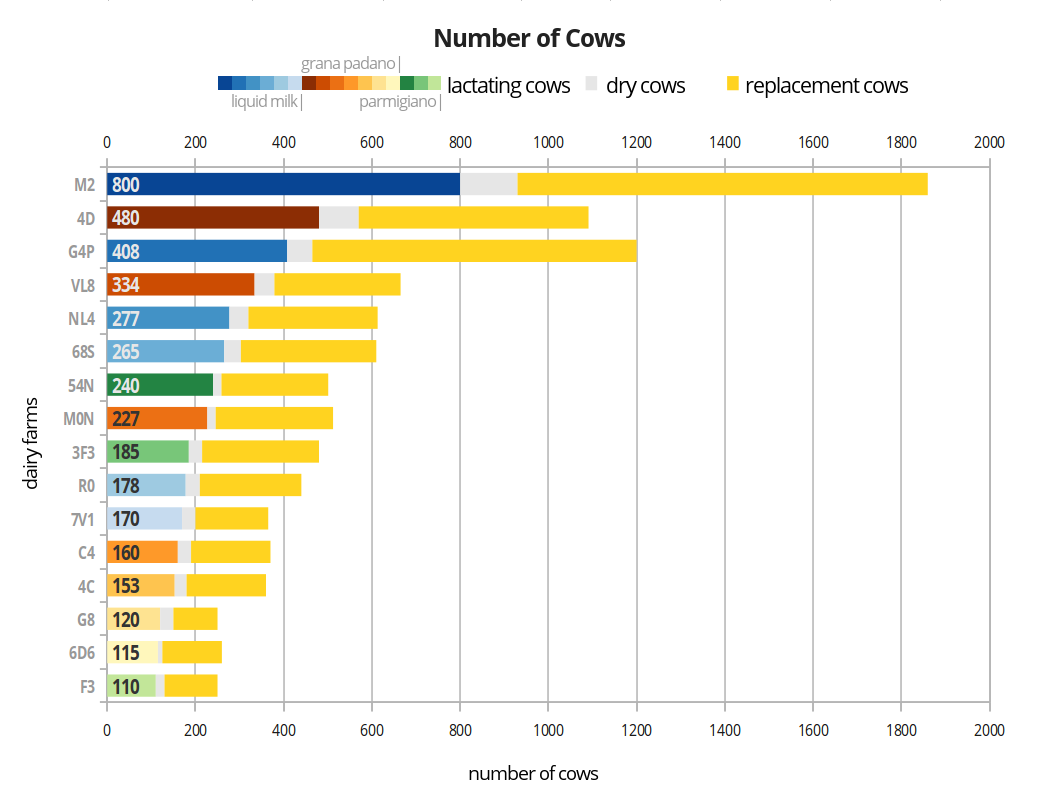
Il grafico sottostante visualizza le Aziende organizzate per numero di capi in lattazione. La prima barra, che misura il numero di capi in lattazione, è colorata secondo la destinazione del latte prodotto: blu per destinazione Latte Alimentare, arancione per destinazione Grana Padano e verde per destinazione Parmigiano-Reggiano.
Israel 2011: 24.4 months
Source: The Israeli Herdbook 2011
| Country | Year | Milk per cow (tons) |
| Italy | 2024 | 86.66 |
| Germany | 2016 | 74.80 |
| France | 2016 | 66.48 |
| Ireland | 2016 | 49.01 |
| The Netherlands | 0.00 | |
| Poland | 2016 | 0.00 |
| Sources: EUROSTAT, AGEA, AIA | ||
RETURNS (2012) FARM S/STEM
Show/hide a detailed breakdown of the Returns considered.
- Sale of milk (quality premiums included)
- Cows sold for slaughter
- Sale of male calves
- Sale of heifers and other replacement animals
- Sale of agricultural products
- Income from photovoltaic energy production
- Income from biogas plant
- Revenues from CAP subsidies
- Revenues from other subsidies
of the market value of concentrated animal feed.
Il grafico sottostante permette di seguire l'evoluzione mensile del valore di mercato degli alimenti concentrati.
È rappresentato il valore dell'Alimento Simulato, un modello teorico di alimento che prevede
esclusivamente l'impiego di mais e farina di estrazione di soia 44 ('nazionale'); è stato assunto a modello in quanto i due
ingredienti che lo compongono sono driver del prezzo di tutte le materie prime disponibili sul mercato.
L'Alimento Simulato ha la seguente composizione:
| Corn meal | 70% | Raw proteins as fed | 19% |
| Soybean extraction meal 44% protein | 30% | Value in MFU | 1,05 |
The monthly price of the products corresponds to the average monthly quotation of the Commodities Exchange of the Milan Chamber of Commerce.
| Brent oil price and forecast | |||||
| 2012 | 2013 | 2014 | 2015 | 2016 | |
| USD/barrel | 111.7 | 108.7 | 105.2 | 100.7 | 101.9 |
| variation over time | -2.75% | -5.84% | -9.87% | -8.80% | |
| Dairy farm fuel, oil & ilubrificants cost: | |||||
| % sui ricavi totali | 4.02% | 3.91% | 3.79% | 3.62% | 3.67% |
| €/100kg of milk | 2.30 | 2.24 | 2.17 | 2.07 | 2.10 |
|
Source: data processed by Intesa Sanpaolo based on Bloomberg data at September 23, 2014 |
|||||
| Electric power price and forecast | ||||
| 2012 | 2013 | 2014 | 2015 | |
| price PUN €/Mwh | 75.53 | 63.00 | 52.00 | 51.00 |
| variation over time | -16.59% | -31.15% | -32.48% | |
| Dairy farm electric power cost: | ||||
| % sui ricavi totali | 2.23% | 1.86% | 1.54% | 1.51% |
| €/100kg of milk | 1.29 | 1.08 | 0.89 | 0.87 |
| Source: data processed by Intesa Sanpaolo based on GME data at November 7, 2014 | ||||
Performance of Dairy Farms
The new spider web chart allows to compare the performance of your dairy Farm with the performance of the dairy Farms participating in the project by entering your data in a simple form.
I grafici sottostanti mostrano l'istantanea della configurazione di Aziende Agricole e Capi da latte in alcuni Paesi europei.
È opportuno confrontare le forme, piuttosto che i valori assoluti (i grafici infatti hanno scale diverse).
Le seconda riga di grafici confronta le quattro regioni italiane più produttive.
For any questions or comments please write to
