Aim
to provide the tools necessary to manage the cultural change towards sustainable production models.
The Water & Energy Project
provides agri-food operators with an updated picture of the problems concerning water and energy use, provides information and indications necessary in order to deal effectively and with full understanding with the many issues related to the responsible management of resources which are vital for the future of our planet.
Good Practices
focuses on how to enhance the value of products, farms and supply chains by focusing on examples of good practices and on environmental sustainability certifications.
Latteria Soresina
I soci allevatori della Latteria Soresina curano grazie alla coltivazione e alla manutenzione del territorio agricolo di loro competenza una superficie pari a circa 1/4 della superficie agricola della provincia di Cremona, provincia tra le più dedicate all'agricoltura... read >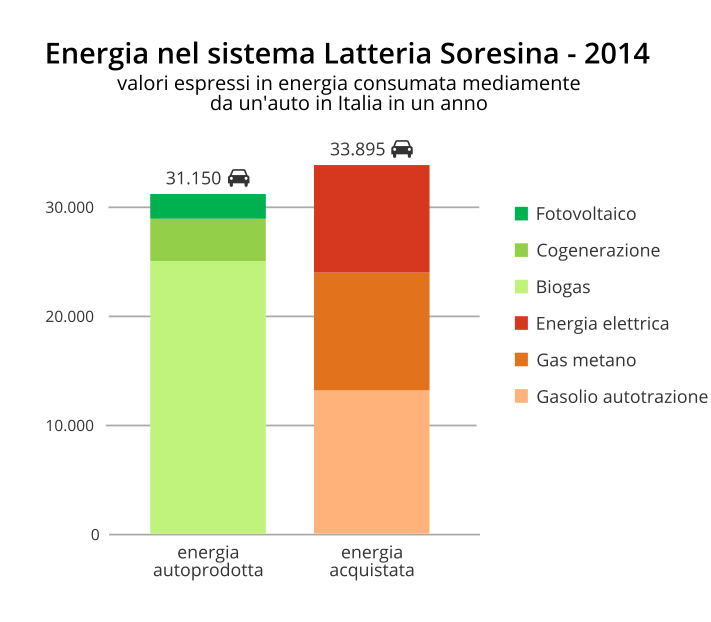
Lattebusche
Lattebusche ha intrapreso un percorso di sostenibilità. La cura che questa cooperativa ha per il territorio in cui vive non si limita all'importante opera dei produttori associati, manutentori naturali dello stesso, ma anche con investimenti, certificazioni e l'azione quotidiana negli stabilimenti di produzione... read >
Latteria Soresina
Maintenance of the territory and production of energy from renewable sources
I soci allevatori della Latteria Soresina curano grazie alla coltivazione e alla manutenzione del territorio agricolo di loro competenza una superficie pari a circa 1/4 della superficie agricola della provincia di Cremona, provincia tra le più dedicate all'agricoltura... read >
Lattebusche
Indicators and results for sustainability
Lattebusche ha intrapreso un percorso di sostenibilità. La cura che questa cooperativa ha per il territorio in cui vive non si limita all'importante opera dei produttori associati, manutentori naturali dello stesso, ma anche con investimenti, certificazioni e l'azione quotidiana negli stabilimenti di produzione... read >Agricultural Market and Fertilizers
| IT, Bologna: NON-GMO Hulled Roasted Soybean Meal - Italian price | Increased | 510 | €/ton |
| IT, Bologna: Chopped corn (Standing plants) | Increased | 52 | €/ton |
| IT, Bologna: Wholegrain Sunflower Meal price | Decreased | 254 | €/ton |
| IT, Bologna: GMO Wholegrain Roasted Soybean Meal - Italian price | Increased | 395 | €/ton |
| IT, Bologna: Barley - s.w. 64 and over | Increased | 218 | €/ton |
| IT, Bologna: NON-GMO Wholegrain Roasted Soybean Meal - Italian price | Increased | 468 | €/ton |
| IT, Bologna: Common Wheat - fino price | Increased | 230 | €/ton |
| IT, Bologna: Corn - Italian for livestock (with characteristics) price | Increased | 259 | €/ton |
| IT, Bologna: Common Wheat - buono mercantile price | Increased | 223 | €/ton |
| IT, Bologna: Barley - s.w. 61-63 price | Increased | 211 | €/ton |
| IT, Bologna: Italian Soybeans price | Increased | 475 | €/ton |
| IT, Bologna: Corn - Italian for livestock (contr. 103) price | Increased | 246 | €/ton |
| IT, Turin - Triple superphosphate 46% | Stabile | 620 | €/ton |
| IT, Turin - Ammonium nitrate 26% | Stabile | 410 | €/ton |
| IT, Turin - Urea 46% | In aumento | 605 | €/ton |
| Simulated Feed Ration (vs prev month) | +0.50% |
| Milk:Feed Ratio | 1.60 |
- Market News evidences only the changes; should no price change or no quotation take place, any mention will be made.
- The change/variation concerning PRODUCTION/OUTPUT quantity refers to the same period of the previous year.
- The change/variation concerning STOCK quantity refers to the previous month.
- The change/variation of price refers to PRICES expressed in local currency (for both EU and the World). The change refers to the previous week/month/year, as the case may be. In the case of dual-listed (min and max), changes are calculated using the MAX PRICE.
Slaughtered cowsenter
Global Snapshot
 /Ton /Ton |
US (15-05-2026) |
Argentina (20-07-2026) |
BRAZIL (17-07-2026) |
ITALY (21-07-2026) |
||||
| Product | Value | % Chg* | Value | % Chg* | Value | % Chg* | Value | % Chg* |
| CORN | 141 | -2,5% | 163 | +2,9% | 185 | -0,6% | 250 | +4,2% |
| SOY | 359 | -1,4% | 297 | +2,4% | 382 | -0,5% | 479 | +4,4% |
| WHEAT | 192 1 | -2,6% | 179 | +4,6% | 223 | -0,7% | 240 | +0,8% |
|
* Change on the previous price quotation.
1) Prezzi riferiti a Hard Red Wheat Fonti: USDA - Cepea - Mercado Rosario - CCIAA Milano Click on CORN, SOYBEAN, or WHEAT to view the corresponding FOB prices below. |
||||||||
| Corn - Export FOB Prices 22-07-2026 | ||||||||
|---|---|---|---|---|---|---|---|---|
| Market | €/Ton | % su quotazione precedente | % su anno precedente | |||||
| US - Gulf (3YC) | 199 | +2,7% | +13,7% | |||||
| Mar Nero (feed) | 199 | +0,4% | -3,4% | |||||
| EU - Bordeaux | - | - | - | |||||
| Wheat - Export FOB Prices 22-07-2026 | ||||||||
| Market | €/Ton | % su quotazione precedente | % su anno precedente | |||||
| US - Gulf (SRW) | 253 | +4,3% | +34,2% | |||||
| EU - Rouen (grade 1) | 245 | +6,1% | +22,8% | |||||
| Ukraine (milling) | 191 | 0,0% | +2,2% | |||||
| US - Gulf (HRW) | 293 | +5,0% | +45,8% | |||||
| Soybeans - Export FOB Prices 22-07-2026 | ||||||||
| Market | €/Ton | % su quotazione precedente | % su anno precedente | |||||
| Argentina - Up River | 411 | +3,7% | +18,7% | |||||
| Brazil - Paranagua | 435 | +2,9% | +19,3% | |||||
| US - Gulf | 437 | +2,4% | +23,5% | |||||
| Ukraine | 381 | 0,0% | +15,5% | |||||
|
Source: International Grains Council, France Agrimer
Visit the full page |
||||||||
Show/Hide Global Snapshot in US$
 /Ton /Ton |
US (15-05-2026) |
Argentina (20-07-2026) |
BRAZIL (17-07-2026) |
ITALY (21-07-2026) |
||||
| Product | Value | % Chg* | Value | % Chg* | Value | % Chg* | Value | % Chg* |
| CORN | 165 | -2,6% | 186 | +2,7% | 212 | -0,1% | 285 | +4,2% |
| SOY | 420 | -1,5% | 339 | +2,2% | 438 | 0,0% | 547 | +4,4% |
| WHEAT | 225 1 | -2,7% | 204 | +4,4% | 256 | -0,1% | 274 | +0,9% |
|
* Change on the previous price quotation.
1) Prezzi riferiti a Hard Red Wheat Fonti: USDA - Cepea - Mercado Rosario - CCIAA Milano Click on CORN, SOYBEAN, or WHEAT to view the corresponding FOB prices below. |
||||||||
| Corn - Export FOB Prices 22-07-2026 | ||||||||
|---|---|---|---|---|---|---|---|---|
| Market | $/Ton | % su quotazione precedente | % su anno precedente | |||||
| US - Gulf (3YC) | 227 | -10,0% | -2,0% | |||||
| Mar Nero (feed) | 227 | -12,0% | -16,7% | |||||
| EU - Bordeaux | - | - | - | |||||
| Wheat - Export FOB Prices 22-07-2026 | ||||||||
| Market | $/Ton | % su quotazione precedente | % su anno precedente | |||||
| US - Gulf (SRW) | 289 | -8,5% | +15,7% | |||||
| EU - Rouen (grade 1) | 279 | -7,0% | +5,9% | |||||
| Ukraine (milling) | 218 | -12,3% | -11,9% | |||||
| US - Gulf (HRW) | 334 | -7,9% | +25,7% | |||||
| Soybeans - Export FOB Prices 22-07-2026 | ||||||||
| Market | $/Ton | % su quotazione precedente | % su anno precedente | |||||
| Argentina - Up River | 469 | -9,0% | +2,3% | |||||
| Brazil - Paranagua | 496 | -9,8% | +2,8% | |||||
| US - Gulf | 499 | -10,2% | +6,4% | |||||
| Ukraine | 435 | -12,3% | -0,4% | |||||
|
Source: International Grains Council, France Agrimer
Visit the full page |
||||||||
Animal diseases
|
data referring to LAST 90 DAYS Since 25/04/2026 to 25/07/2026 |
disease situation and recent outbreaks - Source: FAO | ||
|---|---|---|---|
| WORLD excluding Europe |
EUROPE excluding Italy |
ITALY | |
| DECREASING the United Kingdom of Great Britain and Northern Ireland (2026-07-24) |
DECREASING* |
ABSENT -- |
|
| DECREASING Libya (2026-07-23) and others 9 |
INCREASING Greece (2026-07-24) and others 1 |
ABSENT -- |
|
| DECREASING Bosnia (2026-07-20) and others 7 |
DECREASING Romania (2026-07-24) and others 9 |
INCREASING 2026-07-17 |
|
| ABSENT -- |
ABSENT -- |
ABSENT -- |
|
| INCREASING South Korea (2026-07-11) and others 1 |
ABSENT -- |
DECREASING 2026-07-10 |
|
|
*Note: Given the widespread presence of Bluetongue in France, Germany and the Netherlands, official sources no longer publish regular updates on the number of new outbreaks recorded.. |
|||

Climate Bulletin
Condizioni della Vegetazione
in the World
Mappa globale della variazione dello stato di salute della vegetazione (VHI), rispetto allo stesso periodo dell'anno precedente.
Source: NOAA.
Vegetation health
in the World
Evaluation of soil condition for crop production: deficit, normal, optimal.
Updated at 19 July 2026 - Source: NOAA.
Soybeans
Corn
Wheat
Recent climatic events
(excluding UE)
Extreme climatic events and their location.
Source: GDACS.
| Event | Start | End | Country |
|---|---|---|---|
| Drought | 2026-04-21 | Ongoing | Ethiopia, Kenya… (+1 others |
| Drought | 2025-11-21 | 2026-07-16 | Madagascar |
| Flood | 2026-06-06 | 2026-07-14 | China |
| Cyclone | 2026-07-01 | 2026-07-11 | Guam, Japan… (+2 others |
| Cyclone | 2026-07-01 | 2026-07-04 | China, Laos |
| Drought | 2025-12-11 | 2026-05-28 | Angola, Congo… (+3 others |
| Drought | 2022-09-21 | 2026-05-07 | Argentina, Peru… (+3 others |
| Drought | 2025-11-21 | 2026-04-20 | Argentina… (+1 others |
| Cyclone | 2026-04-09 | 2026-04-19 | Guam |
| Flood | 2026-03-25 | 2026-04-14 | Afghanistan |
| Flood | 2026-02-03 | 2026-03-31 | Brazil |
| Drought | 2025-05-21 | 2026-03-30 | Kenya, Somalia |
| Flood | 2026-03-09 | 2026-03-11 | Ethiopia |
| Flood | 2026-02-22 | Ongoing | … (+1 others |
| Flood | 2026-02-11 | 2026-03-05 | … (+1 others |
Condizioni della Vegetazione
in EU-27
Mappa europea della variazione dello stato di salute della vegetazione (VHI), rispetto allo stesso periodo dell'anno precedente.
Source: NOAA.
Vegetation health
in UE-27
Evaluation of soil condition for crop production: deficit, normal, optimal.
Updated at 19 July 2026 - Source: NOAA.
Soybeans
Corn
Wheat
Recent climatic events
in UE-27
Extreme climatic events and their location.
Source: GDACS.
| Event | Start | End | Country |
|---|---|---|---|
| Drought | 2025-12-11 | 2026-07-16 | Albania, Austria, Belarus … (+23 others |
| Forest Fire | 2026-07-12 | 2026-07-14 | France |
| Forest Fire | 2026-07-09 | 2026-07-11 | Spain |
| Forest Fire | 2026-07-04 | 2026-07-08 | France |
| Forest Fire | 2026-07-02 | 2026-07-08 | Portugal |
Mappa evento selezionato
Market Balances:
Show the data of:
Previous season
Current season
| Previous forecast
| Current forecast
Show the data of:
Previous season
Current season
| Previous forecast
| Current forecast
Show the data of:
Previous season
Current season
| Previous forecast
| Current forecast
Show the data of:
Previous season
Current season
| Previous forecast
| Current forecast
Show the data of:
Previous season
Current season
| Previous forecast
| Current forecast
Show the data of:
Previous season
Current season
| Previous forecast
| Current forecast
Show the data of:
Previous season
Current season
| Previous forecast
| Current forecast
Show the data of:
Previous season
Current season
| Previous forecast
| Current forecast
Show the data of:
Previous season
Current season
| Previous forecast
| Current forecast
Show the data of:
Previous season
Current season
| Previous forecast
| Current forecast
Show the data of:
Previous season
Current season
| Previous forecast
| Current forecast
|
Corn
| Balance sheet in Mio Tons
Year 2026-27 (Forecast July)
Prices Corn US
Forecast 2026-27 Increasing Rispetto all'annata 2025-26 |
||||||||||||
|---|---|---|---|---|---|---|---|---|---|---|---|---|
| Country | Beginning Stocks | Production | Import | Export | Consumption | Ending Stocks | ||||||
| World | 298.67 | +0.8% | 1297.09 | -2.3% | 204.00 | +3.7% | 209.88 | -4.9% | 1314.61 | +1.0% | 275.26 | -7.8% |
| United States | 51.31 | +30.2% | 406.42 | -6.0% | 0.64 | -10.7% | 81.28 | -3.8% | 331.61 | -1.5% | 45.46 | -11.4% |
| Share % | 17.2% | 31.3% | 0.3% | 38.7% | 25.2% | 16.5% | ||||||
| China | 177.15 | -7.7% | 307.00 | +1.9% | 6.00 | +20.0% | 0.02 | 0.0% | 325.00 | +1.2% | 165.13 | -6.8% |
| Share % | 59.3% | 23.7% | 2.9% | 0.0% | 24.7% | 60.0% | ||||||
| Brazil | 12.30 | +6.0% | 139.00 | +0.7% | 1.80 | +5.9% | 44.00 | +2.3% | 98.00 | +2.1% | 11.10 | -9.8% |
| Share % | 4.1% | 10.7% | 0.9% | 21.0% | 7.5% | 4.0% | ||||||
| Argentina | 4.71 | -11.2% | 55.00 | -12.7% | 0.01 | 0.0% | 38.00 | -15.6% | 17.70 | -4.8% | 4.01 | -14.8% |
| Share % | 1.6% | 4.2% | 0.0% | 18.1% | 1.3% | 1.5% | ||||||
| EU-27 | 5.08 | -13.6% | 53.78 | -5.3% | 22.50 | +21.6% | 1.90 | -9.5% | 74.40 | +0.5% | 5.06 | -0.5% |
| Share % | 1.7% | 4.1% | 11.0% | 0.9% | 5.7% | 1.8% | ||||||
| Source: USDA - WASDE, Last Update: 2026-07-11 | Visit the page with more detailed information | |||||||||||
| Corn - Balance sheet in Mio Tons | Year 2026-27 (Forecast Giugno) | ||||||||||||
|---|---|---|---|---|---|---|---|---|---|---|---|---|
| Country | Beginning Stocks | Production | Import | Export | Consumption | Ending Stocks | ||||||
| World | 600.31 | +102.7% | 2595.77 | +95.5% | 398.22 | +102.4% | 414.52 | +87.9% | 2621.01 | +101.4% | 558.76 | +87.1% |
| United States | 54.48 | +38.3% | 406.29 | -6.0% | 0.64 | -10.7% | 80.01 | -5.3% | 331.61 | -1.5% | 49.78 | -3.0% |
| Share % | 18.2% | 31.3% | 0.3% | 38.1% | 25.2% | 18.1% | ||||||
| China | 178.15 | -7.2% | 307.00 | +1.9% | 6.00 | +20.0% | 0.02 | 0.0% | 325.00 | +1.2% | 166.13 | -6.2% |
| Share % | 59.6% | 23.7% | 2.9% | 0.0% | 24.7% | 60.4% | ||||||
| Brazil | 12.30 | +6.0% | 139.00 | +0.7% | 1.80 | +5.9% | 44.00 | +2.3% | 98.00 | +2.1% | 11.10 | -9.8% |
| Share % | 4.1% | 10.7% | 0.9% | 21.0% | 7.5% | 4.0% | ||||||
| Argentina | 4.71 | -11.2% | 55.00 | -12.7% | 0.01 | 0.0% | 38.00 | -15.6% | 17.70 | -4.8% | 4.01 | -14.8% |
| Share % | 1.6% | 4.2% | 0.0% | 18.1% | 1.3% | 1.5% | ||||||
| EU-27 | 5.08 | -13.6% | 57.50 | +1.2% | 19.50 | +5.4% | 1.90 | -9.5% | 74.80 | +1.1% | 5.38 | +5.9% |
| Share % | 1.7% | 4.4% | 9.6% | 0.9% | 5.7% | 2.0% | ||||||
| Source: USDA, Last Update: 2026-07-11 | Visit the page with more detailed information | |||||||||||
| Corn - Balance sheet in Mio Tons | Year 2025-26 | ||||||||||||
|---|---|---|---|---|---|---|---|---|---|---|---|---|
| Country | Beginning Stocks | Production | Import | Export | Consumption | Ending Stocks | ||||||
| World | 296.21 | -5.6% | 1327.70 | +7.6% | 196.73 | +5.7% | 220.66 | +17.7% | 1301.30 | +4.1% | 298.67 | +0.8% |
| United States | 39.40 | -12.0% | 432.34 | +14.3% | 0.71 | +29.3% | 84.46 | +15.8% | 336.69 | +8.2% | 51.31 | +30.2% |
| Share % | 13.3% | 32.6% | 0.4% | 38.3% | 25.9% | 17.2% | ||||||
| China | 191.93 | -9.1% | 301.24 | +2.1% | 5.00 | +174.3% | 0.02 | +400.0% | 321.00 | +1.6% | 177.15 | -7.7% |
| Share % | 64.8% | 22.7% | 2.5% | 0.0% | 24.7% | 59.3% | ||||||
| Brazil | 11.60 | +57.8% | 138.00 | +1.5% | 1.70 | -3.5% | 43.00 | +2.4% | 96.00 | +4.9% | 12.30 | +6.0% |
| Share % | 3.9% | 10.4% | 0.9% | 19.5% | 7.4% | 4.1% | ||||||
| Argentina | 5.30 | +115.4% | 63.00 | +28.6% | 0.01 | 0.0% | 45.00 | +54.8% | 18.60 | +8.8% | 4.71 | -11.2% |
| Share % | 1.8% | 4.7% | 0.0% | 20.4% | 1.4% | 1.6% | ||||||
| EU-27 | 5.88 | -19.4% | 56.80 | -4.7% | 18.50 | -1.4% | 2.10 | -23.9% | 74.00 | -3.9% | 5.08 | -13.6% |
| Share % | 2.0% | 4.3% | 9.4% | 1.0% | 5.7% | 1.7% | ||||||
| Source: USDA, Last Update: 2026-07-11 | Visit the page with more detailed information | |||||||||||
|
Soybean
| Balance sheet in Mio Tons
Year 2026-27 (Forecast July)
Prices Soybean US
Forecast 2026-27 Increasing Rispetto all'annata 2025-26 |
||||||||||||
|---|---|---|---|---|---|---|---|---|---|---|---|---|
| Country | Beginning Stocks | Production | Import | Export | Consumption | Ending Stocks | ||||||
| World | 125.33 | -0.5% | 441.70 | +2.9% | 189.27 | +1.6% | 190.41 | +1.8% | 441.72 | +2.9% | 124.17 | -0.9% |
| Brazil | 37.69 | 0.0% | 186.00 | +3.3% | 0.80 | -11.1% | 118.00 | +2.6% | 69.60 | +5.6% | 36.89 | -2.1% |
| Share % | 30.1% | 42.1% | 0.4% | 62.0% | 15.8% | 29.7% | ||||||
| United States | 8.98 | +1.6% | 121.79 | +5.0% | 0.68 | 0.0% | 45.18 | +9.2% | 77.84 | +3.6% | 8.44 | -6.0% |
| Share % | 7.2% | 27.6% | 0.4% | 23.7% | 17.6% | 6.8% | ||||||
| Argentina | 23.82 | -3.4% | 50.00 | 0.0% | 6.50 | -7.8% | 6.20 | -31.1% | 49.90 | +2.0% | 24.22 | +1.7% |
| Share % | 19.0% | 11.3% | 3.4% | 3.3% | 11.3% | 19.5% | ||||||
| China | 44.37 | -0.3% | 21.00 | +0.5% | 115.00 | +1.8% | 0.10 | -16.7% | 136.00 | +1.6% | 44.27 | -0.2% |
| Share % | 35.4% | 4.8% | 60.8% | 0.1% | 30.8% | 35.7% | ||||||
| India | 0.74 | +12.4% | 11.50 | +4.3% | 0.20 | -71.4% | 0.03 | +25.0% | 11.88 | +2.2% | 0.54 | -27.0% |
| Share % | 0.6% | 2.6% | 0.1% | 0.0% | 2.7% | 0.4% | ||||||
| Source: USDA - WASDE, Last Update: 2026-07-11 | Visit the page with more detailed information | |||||||||||
| Soybean - Balance sheet in Mio Tons | Year 2026-27 (Forecast Giugno) | ||||||||||||
|---|---|---|---|---|---|---|---|---|---|---|---|---|
| Country | Beginning Stocks | Production | Import | Export | Consumption | Ending Stocks | ||||||
| World | 125.52 | -0.3% | 441.34 | +2.8% | 188.02 | +0.9% | 189.22 | +1.1% | 440.78 | +2.7% | 124.88 | -0.4% |
| Brazil | 37.69 | 0.0% | 186.00 | +3.3% | 0.80 | -11.1% | 117.50 | +2.2% | 69.60 | +5.6% | 37.39 | -0.8% |
| Share % | 30.1% | 42.1% | 0.4% | 61.7% | 15.8% | 30.1% | ||||||
| United States | 9.25 | +4.6% | 120.70 | +4.1% | 0.68 | 0.0% | 44.36 | +7.2% | 77.83 | +3.5% | 8.44 | -6.0% |
| Share % | 7.4% | 27.3% | 0.4% | 23.3% | 17.6% | 6.8% | ||||||
| Argentina | 23.82 | -3.4% | 50.00 | 0.0% | 6.50 | -7.8% | 6.20 | -31.1% | 49.90 | +2.0% | 24.22 | +1.7% |
| Share % | 19.0% | 11.3% | 3.4% | 3.3% | 11.3% | 19.5% | ||||||
| China | 44.37 | -0.3% | 21.00 | +0.5% | 114.00 | +0.9% | 0.10 | -16.7% | 135.00 | +0.8% | 44.27 | -0.2% |
| Share % | 35.4% | 4.8% | 60.2% | 0.1% | 30.6% | 35.7% | ||||||
| India | 0.74 | +12.4% | 11.50 | +4.3% | 0.20 | -71.4% | 0.03 | +25.0% | 11.88 | +2.2% | 0.54 | -27.0% |
| Share % | 0.6% | 2.6% | 0.1% | 0.0% | 2.7% | 0.4% | ||||||
| Source: USDA, Last Update: 2026-07-11 | Visit the page with more detailed information | |||||||||||
| Soybean - Balance sheet in Mio Tons | Year 2025-26 | ||||||||||||
|---|---|---|---|---|---|---|---|---|---|---|---|---|
| Country | Beginning Stocks | Production | Import | Export | Consumption | Ending Stocks | ||||||
| World | 125.93 | +9.4% | 429.46 | +0.3% | 186.34 | +4.0% | 187.08 | +1.5% | 429.33 | +4.2% | 125.33 | -0.5% |
| Brazil | 37.69 | +26.6% | 180.00 | +4.3% | 0.90 | +23.1% | 115.00 | +11.5% | 65.90 | +6.0% | 37.69 | 0.0% |
| Share % | 29.9% | 41.9% | 0.5% | 61.5% | 15.3% | 30.1% | ||||||
| United States | 8.84 | -5.1% | 115.99 | -2.6% | 0.68 | -15.6% | 41.37 | -19.7% | 75.16 | +9.2% | 8.98 | +1.6% |
| Share % | 7.0% | 27.0% | 0.4% | 22.1% | 17.5% | 7.2% | ||||||
| Argentina | 24.67 | +2.6% | 50.00 | -2.2% | 7.05 | +11.5% | 9.00 | +14.3% | 48.90 | -0.1% | 23.82 | -3.4% |
| Share % | 19.6% | 11.6% | 3.8% | 4.8% | 11.4% | 19.0% | ||||||
| China | 44.49 | +2.7% | 20.90 | +1.2% | 113.00 | +4.6% | 0.12 | +66.7% | 133.90 | +5.1% | 44.37 | -0.3% |
| Share % | 35.3% | 4.9% | 60.6% | 0.1% | 31.2% | 35.4% | ||||||
| India | 0.66 | -29.5% | 11.03 | -14.4% | 0.70 | > +1000% | 0.02 | +66.7% | 11.63 | -11.6% | 0.74 | +12.4% |
| Share % | 0.5% | 2.6% | 0.4% | 0.0% | 2.7% | 0.6% | ||||||
| Source: USDA, Last Update: 2026-07-11 | Visit the page with more detailed information | |||||||||||
|
Wheat
| Balance sheet in Mio Tons
Year 2026-27 (Forecast July)
Prices Wheat US
Forecast 2026-27 Increasing Rispetto all'annata 2025-26 |
||||||||||||
|---|---|---|---|---|---|---|---|---|---|---|---|---|
| Country | Beginning Stocks | Production | Import | Export | Consumption | Ending Stocks | ||||||
| World | 279.04 | +7.4% | 819.97 | -2.8% | 208.17 | -6.2% | 213.05 | -6.2% | 821.28 | +0.2% | 272.84 | -2.2% |
| China | 122.65 | -4.0% | 141.00 | +0.7% | 6.00 | +3.4% | 1.00 | 0.0% | 148.00 | -1.3% | 120.65 | -1.6% |
| Share % | 44.0% | 17.2% | 2.9% | 0.5% | 18.0% | 44.2% | ||||||
| EU-27 | 16.58 | +47.1% | 136.00 | -6.3% | 6.50 | -9.7% | 31.00 | -1.6% | 113.75 | -1.5% | 14.33 | -13.6% |
| Share % | 5.9% | 16.6% | 3.1% | 14.6% | 13.9% | 5.3% | ||||||
| India | 21.80 | +84.7% | 121.00 | +2.6% | 0.10 | -21.9% | 2.00 | +743.9% | 111.40 | +3.3% | 29.50 | +35.3% |
| Share % | 7.8% | 14.8% | 0.0% | 0.9% | 13.6% | 10.8% | ||||||
| Russia | 11.99 | +13.2% | 88.50 | -2.0% | 0.30 | 0.0% | 47.50 | -1.0% | 41.20 | 0.0% | 12.09 | +0.8% |
| Share % | 4.3% | 10.8% | 0.1% | 22.3% | 5.0% | 4.4% | ||||||
| United States | 25.04 | +7.6% | 41.81 | -22.6% | 3.81 | +12.1% | 21.09 | -14.6% | 29.91 | -3.3% | 19.66 | -21.5% |
| Share % | 9.0% | 5.1% | 1.8% | 9.9% | 3.6% | 7.2% | ||||||
| Source: USDA - WASDE, Last Update: 2026-07-11 | Visit the page with more detailed information | |||||||||||
| Wheat - Balance sheet in Mio Tons | Year 2026-27 (Forecast Giugno) | ||||||||||||
|---|---|---|---|---|---|---|---|---|---|---|---|---|
| Country | Beginning Stocks | Production | Import | Export | Consumption | Ending Stocks | ||||||
| World | 559.16 | +115.2% | 1639.13 | +94.3% | 414.60 | +86.7% | 423.65 | +86.6% | 1638.76 | +100.0% | 550.47 | +97.3% |
| China | 122.85 | -3.9% | 141.00 | +0.7% | 6.00 | +3.4% | 1.00 | 0.0% | 148.00 | -1.3% | 120.85 | -1.5% |
| Share % | 44.0% | 17.2% | 2.9% | 0.5% | 18.0% | 44.3% | ||||||
| EU-27 | 16.88 | +49.7% | 136.00 | -6.3% | 6.50 | -9.7% | 31.00 | -1.6% | 113.75 | -1.5% | 14.63 | -11.8% |
| Share % | 6.0% | 16.6% | 3.1% | 14.6% | 13.9% | 5.4% | ||||||
| India | 22.00 | +86.4% | 121.00 | +2.6% | 0.10 | -21.9% | 2.00 | +743.9% | 111.10 | +3.0% | 30.00 | +37.6% |
| Share % | 7.9% | 14.8% | 0.0% | 0.9% | 13.5% | 11.0% | ||||||
| Russia | 13.49 | +27.4% | 88.00 | -2.5% | 0.30 | 0.0% | 47.00 | -2.1% | 41.20 | 0.0% | 12.59 | +5.0% |
| Share % | 4.8% | 10.7% | 0.1% | 22.1% | 5.0% | 4.6% | ||||||
| United States | 25.44 | +9.3% | 42.01 | -22.2% | 3.81 | +12.1% | 21.09 | -14.6% | 29.91 | -3.3% | 20.25 | -19.1% |
| Share % | 9.1% | 5.1% | 1.8% | 9.9% | 3.6% | 7.4% | ||||||
| Source: USDA, Last Update: 2026-07-11 | Visit the page with more detailed information | |||||||||||
| Wheat - Balance sheet in Mio Tons | Year 2025-26 | ||||||||||||
|---|---|---|---|---|---|---|---|---|---|---|---|---|
| Country | Beginning Stocks | Production | Import | Export | Consumption | Ending Stocks | ||||||
| World | 259.88 | -3.8% | 843.77 | +5.5% | 222.01 | +10.5% | 227.08 | +7.9% | 819.54 | +2.4% | 279.04 | +7.4% |
| China | 127.78 | -5.0% | 140.07 | 0.0% | 5.80 | +39.1% | 1.00 | -1.6% | 150.00 | 0.0% | 122.65 | -4.0% |
| Share % | 49.2% | 16.6% | 2.6% | 0.4% | 18.3% | 44.0% | ||||||
| EU-27 | 11.27 | -29.2% | 145.11 | +19.9% | 7.20 | -32.8% | 31.50 | +12.8% | 115.50 | +6.5% | 16.58 | +47.1% |
| Share % | 4.3% | 17.2% | 3.2% | 13.9% | 14.1% | 5.9% | ||||||
| India | 11.80 | +57.3% | 117.95 | +4.1% | 0.13 | -17.4% | 0.24 | +27.4% | 107.84 | -1.0% | 21.80 | +84.7% |
| Share % | 4.5% | 14.0% | 0.1% | 0.1% | 13.2% | 7.8% | ||||||
| Russia | 10.59 | -9.4% | 90.30 | +10.7% | 0.30 | 0.0% | 48.00 | +11.6% | 41.20 | +3.0% | 11.99 | +13.2% |
| Share % | 4.1% | 10.7% | 0.1% | 21.1% | 5.0% | 4.3% | ||||||
| United States | 23.26 | +22.7% | 54.01 | +0.3% | 3.40 | -16.6% | 24.71 | +9.5% | 30.92 | -0.4% | 25.04 | +7.6% |
| Share % | 9.0% | 6.4% | 1.5% | 10.9% | 3.8% | 9.0% | ||||||
| Source: USDA, Last Update: 2026-07-11 | Visit the page with more detailed information | |||||||||||
|
Barley
| Balance sheet in Mio Tons
Year 2026-27 (Forecast July)
Prices Barley US
Forecast 2026-27 Increasing Rispetto all'annata 2025-26 |
||||||||||||
|---|---|---|---|---|---|---|---|---|---|---|---|---|
| Country | Beginning Stocks | Production | Import | Export | Consumption | Ending Stocks | ||||||
| World | 20.46 | +11.4% | 155.62 | +0.7% | 28.44 | -17.4% | 30.24 | -15.2% | 153.38 | +1.5% | 20.90 | +2.1% |
| EU-27 | 6.25 | +11.4% | 53.15 | -5.7% | 0.70 | 0.0% | 7.40 | -15.9% | 46.60 | -2.2% | 6.10 | -2.4% |
| Share % | 30.5% | 34.2% | 2.5% | 24.5% | 30.4% | 29.2% | ||||||
| Russia | 0.56 | +80.1% | 18.50 | -4.6% | 0.05 | 0.0% | 3.70 | -15.9% | 14.90 | +0.7% | 0.51 | -8.9% |
| Share % | 2.7% | 11.9% | 0.2% | 12.2% | 9.7% | 2.4% | ||||||
| Australia | 1.21 | +36.8% | 14.10 | -15.2% | 0.00 | 0.0% | 7.50 | -29.9% | 6.30 | +12.5% | 1.51 | +24.8% |
| Share % | 5.9% | 9.1% | 0.0% | 24.8% | 4.1% | 7.2% | ||||||
| Canada | 1.09 | -12.4% | 9.30 | -4.4% | 0.13 | +4.2% | 2.70 | -15.6% | 6.75 | -0.7% | 1.07 | -2.3% |
| Share % | 5.3% | 6.0% | 0.5% | 8.9% | 4.4% | 5.1% | ||||||
| Turkey | 0.59 | -14.6% | 8.80 | +72.5% | 0.15 | -90.0% | 0.05 | -83.3% | 8.50 | +32.8% | 0.99 | +68.1% |
| Share % | 2.9% | 5.7% | 0.5% | 0.2% | 5.5% | 4.7% | ||||||
| Source: USDA - WASDE, Last Update: 2026-07-11 | Visit the page with more detailed information | |||||||||||
| Barley - Balance sheet in Mio Tons | Year 2026-27 (Forecast Giugno) | ||||||||||||
|---|---|---|---|---|---|---|---|---|---|---|---|---|
| Country | Beginning Stocks | Production | Import | Export | Consumption | Ending Stocks | ||||||
| World | 42.01 | +128.7% | 310.49 | +101.0% | 56.88 | +65.1% | 59.96 | +68.0% | 306.69 | +102.9% | 42.73 | +108.8% |
| EU-27 | 7.05 | +25.6% | 53.15 | -5.7% | 0.70 | 0.0% | 7.60 | -13.6% | 46.90 | -1.6% | 6.40 | +2.4% |
| Share % | 34.5% | 34.2% | 2.5% | 25.1% | 30.6% | 30.6% | ||||||
| Russia | 0.96 | +208.3% | 18.50 | -4.6% | 0.05 | 0.0% | 3.70 | -15.9% | 14.90 | +0.7% | 0.91 | +62.3% |
| Share % | 4.7% | 11.9% | 0.2% | 12.2% | 9.7% | 4.4% | ||||||
| Australia | 1.41 | +59.4% | 14.10 | -15.2% | 0.00 | 0.0% | 7.50 | -29.9% | 6.30 | +12.5% | 1.71 | +41.3% |
| Share % | 6.9% | 9.1% | 0.0% | 24.8% | 4.1% | 8.2% | ||||||
| Canada | 1.09 | -12.4% | 9.00 | -7.5% | 0.13 | +4.2% | 2.50 | -21.9% | 6.75 | -0.7% | 0.97 | -11.4% |
| Share % | 5.3% | 5.8% | 0.5% | 8.3% | 4.4% | 4.6% | ||||||
| Turkey | 0.59 | -14.6% | 8.80 | +72.5% | 0.15 | -90.0% | 0.05 | -83.3% | 8.50 | +32.8% | 0.99 | +68.1% |
| Share % | 2.9% | 5.7% | 0.5% | 0.2% | 5.5% | 4.7% | ||||||
| Source: USDA, Last Update: 2026-07-11 | Visit the page with more detailed information | |||||||||||
| Barley - Balance sheet in Mio Tons | Year 2025-26 | ||||||||||||
|---|---|---|---|---|---|---|---|---|---|---|---|---|
| Country | Beginning Stocks | Production | Import | Export | Consumption | Ending Stocks | ||||||
| World | 18.37 | -15.2% | 154.49 | +7.7% | 34.45 | +17.5% | 35.69 | +17.7% | 151.17 | +3.8% | 20.46 | +11.4% |
| EU-27 | 5.61 | +3.6% | 56.39 | +11.6% | 0.70 | -43.0% | 8.80 | +41.9% | 47.65 | +5.1% | 6.25 | +11.4% |
| Share % | 30.5% | 36.5% | 2.0% | 24.7% | 31.5% | 30.5% | ||||||
| Russia | 0.31 | -56.2% | 19.40 | +19.4% | 0.05 | 0.0% | 4.40 | +29.4% | 14.80 | +11.3% | 0.56 | +80.1% |
| Share % | 1.7% | 12.6% | 0.1% | 12.3% | 9.8% | 2.7% | ||||||
| Australia | 0.89 | -32.9% | 16.63 | +25.3% | 0.00 | 0.0% | 10.70 | +28.9% | 5.60 | +3.7% | 1.21 | +36.8% |
| Share % | 4.8% | 10.8% | 0.0% | 30.0% | 3.7% | 5.9% | ||||||
| Canada | 1.25 | +8.4% | 9.73 | +19.4% | 0.12 | -29.0% | 3.20 | +52.2% | 6.80 | +11.2% | 1.09 | -12.4% |
| Share % | 6.8% | 6.3% | 0.3% | 9.0% | 4.5% | 5.3% | ||||||
| Turkey | 0.69 | -67.1% | 5.10 | -27.1% | 1.50 | +874.0% | 0.30 | -74.0% | 6.40 | -13.5% | 0.59 | -14.6% |
| Share % | 3.8% | 3.3% | 4.4% | 0.8% | 4.2% | 2.9% | ||||||
| Source: USDA, Last Update: 2026-07-11 | Visit the page with more detailed information | |||||||||||
| Sunflowerseed - Balance sheet in Mio Tons | Year 2026-27 (Forecast July) | ||||||||||||
|---|---|---|---|---|---|---|---|---|---|---|---|---|
| Country | Beginning Stocks | Production | Import | Export | Consumption | Ending Stocks | ||||||
| World | 2.87 | +13.0% | 62.66 | +13.3% | 3.40 | -16.4% | 3.74 | -13.4% | 60.99 | +11.5% | 4.20 | +46.1% |
| Russia | 0.75 | +7.2% | 20.70 | +18.3% | 0.05 | -28.6% | 0.60 | +100.0% | 19.38 | +12.5% | 1.52 | +103.1% |
| Share % | 26.1% | 33.0% | 1.5% | 16.0% | 31.8% | 36.2% | ||||||
| Ukraine | 0.15 | -50.8% | 13.00 | +18.2% | 0.03 | 0.0% | 0.10 | +185.7% | 12.78 | +14.6% | 0.31 | +103.3% |
| Share % | 5.2% | 20.7% | 0.9% | 2.7% | 21.0% | 7.4% | ||||||
| EU-27 | 0.43 | +26.5% | 9.80 | +13.2% | 1.10 | -8.3% | 0.55 | -54.2% | 10.22 | +19.3% | 0.57 | +31.4% |
| Share % | 15.0% | 15.6% | 32.4% | 14.7% | 16.8% | 13.6% | ||||||
| Argentina | 0.74 | +33.2% | 8.00 | +8.1% | 0.00 | -90.0% | 1.00 | +17.6% | 6.80 | +6.7% | 0.94 | +27.1% |
| Share % | 25.8% | 12.8% | 0.0% | 26.7% | 11.1% | 22.4% | ||||||
| Kazakhstan | 0.05 | +35.0% | 2.50 | +1.5% | 0.15 | 0.0% | 0.20 | -7.0% | 2.44 | +2.1% | 0.07 | +27.8% |
| Share % | 1.7% | 4.0% | 4.4% | 5.3% | 4.0% | 1.7% | ||||||
| Source: USDA - WASDE, Last Update: 2026-07-11 | Visit the page with more detailed information | |||||||||||
| Sunflowerseed - Balance sheet in Mio Tons | Year 2026-27 (Forecast Giugno) | ||||||||||||
|---|---|---|---|---|---|---|---|---|---|---|---|---|
| Country | Beginning Stocks | Production | Import | Export | Consumption | Ending Stocks | ||||||
| World | 2.87 | +12.8% | 62.06 | +12.3% | 3.20 | -21.3% | 3.54 | -18.0% | 60.65 | +10.9% | 3.95 | +37.5% |
| Russia | 0.75 | +7.2% | 19.50 | +11.4% | 0.05 | -28.6% | 0.30 | 0.0% | 18.78 | +9.1% | 1.22 | +62.9% |
| Share % | 26.1% | 31.1% | 1.5% | 8.0% | 30.8% | 29.0% | ||||||
| Ukraine | 0.15 | -50.8% | 13.50 | +22.7% | 0.03 | 0.0% | 0.10 | +185.7% | 13.28 | +19.1% | 0.31 | +103.3% |
| Share % | 5.2% | 21.5% | 0.9% | 2.7% | 21.8% | 7.4% | ||||||
| EU-27 | 0.35 | +1.5% | 9.90 | +14.4% | 0.90 | -25.0% | 0.55 | -54.2% | 10.06 | +17.4% | 0.54 | +25.6% |
| Share % | 12.2% | 15.8% | 26.5% | 14.7% | 16.5% | 12.9% | ||||||
| Argentina | 0.78 | +40.5% | 8.00 | +8.1% | 0.00 | -90.0% | 1.00 | +17.6% | 6.80 | +6.7% | 0.99 | +32.6% |
| Share % | 27.2% | 12.8% | 0.0% | 26.7% | 11.1% | 23.6% | ||||||
| Kazakhstan | 0.05 | +35.0% | 2.50 | +1.5% | 0.15 | 0.0% | 0.30 | +39.5% | 2.34 | -2.1% | 0.07 | +27.8% |
| Share % | 1.7% | 4.0% | 4.4% | 8.0% | 3.8% | 1.7% | ||||||
| Source: USDA, Last Update: 2026-07-11 | Visit the page with more detailed information | |||||||||||
| Sunflowerseed - Balance sheet in Mio Tons | Year 2025-26 | ||||||||||||
|---|---|---|---|---|---|---|---|---|---|---|---|---|
| Country | Beginning Stocks | Production | Import | Export | Consumption | Ending Stocks | ||||||
| World | 2.54 | -20.5% | 55.28 | +4.3% | 4.07 | +56.0% | 4.32 | +28.0% | 54.71 | +3.4% | 2.87 | +13.0% |
| Russia | 0.70 | -2.8% | 17.50 | +3.6% | 0.07 | -12.5% | 0.30 | +50.0% | 17.22 | +2.5% | 0.75 | +7.2% |
| Share % | 27.6% | 31.7% | 1.7% | 6.9% | 31.5% | 26.1% | ||||||
| Ukraine | 0.31 | +73.3% | 11.00 | -15.4% | 0.03 | +36.4% | 0.04 | -48.5% | 11.15 | -13.1% | 0.15 | -50.8% |
| Share % | 12.2% | 19.9% | 0.7% | 0.9% | 20.4% | 5.2% | ||||||
| EU-27 | 0.34 | -40.0% | 8.66 | +0.1% | 1.20 | +106.2% | 1.20 | +45.6% | 8.57 | -0.8% | 0.43 | +26.5% |
| Share % | 13.4% | 15.7% | 29.5% | 27.8% | 15.7% | 15.0% | ||||||
| Argentina | 0.56 | -32.0% | 7.40 | +32.3% | 0.01 | +900.0% | 0.85 | +35.8% | 6.38 | +21.9% | 0.74 | +33.2% |
| Share % | 22.0% | 13.4% | 0.2% | 19.7% | 11.7% | 25.8% | ||||||
| Kazakhstan | 0.04 | +73.9% | 2.46 | +34.4% | 0.15 | +7.9% | 0.22 | -4.0% | 2.39 | +37.7% | 0.05 | +35.0% |
| Share % | 1.6% | 4.5% | 3.7% | 5.1% | 4.4% | 1.7% | ||||||
| Source: USDA, Last Update: 2026-07-11 | Visit the page with more detailed information | |||||||||||
| Rapeseed - Balance sheet in Mio Tons | Year 2026-27 (Forecast July) | ||||||||||||
|---|---|---|---|---|---|---|---|---|---|---|---|---|
| Country | Beginning Stocks | Production | Import | Export | Consumption | Ending Stocks | ||||||
| World | 11.55 | +16.2% | 97.59 | +2.1% | 18.37 | +1.6% | 18.62 | +0.4% | 96.71 | +3.4% | 12.18 | +5.5% |
| Canada | 2.43 | +64.4% | 22.00 | 0.0% | 0.15 | 0.0% | 7.85 | -4.3% | 13.90 | +6.9% | 2.83 | +16.5% |
| Share % | 21.0% | 22.5% | 0.8% | 42.2% | 14.4% | 23.2% | ||||||
| EU-27 | 2.42 | +7.7% | 20.50 | -0.1% | 5.75 | -11.5% | 0.50 | -23.1% | 25.88 | -1.2% | 2.29 | -5.2% |
| Share % | 21.0% | 21.0% | 31.3% | 2.7% | 26.8% | 18.8% | ||||||
| China | 3.63 | -14.7% | 16.20 | +1.3% | 4.80 | +33.3% | 0.00 | 0.0% | 20.83 | +3.0% | 3.81 | +4.8% |
| Share % | 31.4% | 16.6% | 26.1% | 0.0% | 21.5% | 31.3% | ||||||
| India | 0.56 | +4.6% | 12.40 | +3.3% | 0.00 | 0.0% | 0.00 | 0.0% | 12.43 | +3.8% | 0.54 | -4.4% |
| Share % | 4.8% | 12.7% | 0.0% | 0.0% | 12.9% | 4.4% | ||||||
| Australia | 0.87 | +311.4% | 6.80 | -11.5% | 0.00 | 0.0% | 5.30 | -4.5% | 1.55 | +5.1% | 0.82 | -5.5% |
| Share % | 7.5% | 7.0% | 0.0% | 28.5% | 1.6% | 6.7% | ||||||
| Source: USDA - WASDE, Last Update: 2026-07-11 | Visit the page with more detailed information | |||||||||||
| Rapeseed - Balance sheet in Mio Tons | Year 2026-27 (Forecast Giugno) | ||||||||||||
|---|---|---|---|---|---|---|---|---|---|---|---|---|
| Country | Beginning Stocks | Production | Import | Export | Consumption | Ending Stocks | ||||||
| World | 11.85 | +19.2% | 96.91 | +1.4% | 18.40 | +1.8% | 18.54 | 0.0% | 96.45 | +3.2% | 12.18 | +5.4% |
| Canada | 3.03 | +105.0% | 22.00 | 0.0% | 0.15 | 0.0% | 8.20 | 0.0% | 13.85 | +6.5% | 3.13 | +28.9% |
| Share % | 26.2% | 22.5% | 0.8% | 44.0% | 14.3% | 25.7% | ||||||
| EU-27 | 2.22 | -1.2% | 20.50 | -0.1% | 5.75 | -11.5% | 0.50 | -23.1% | 25.80 | -1.5% | 2.17 | -10.4% |
| Share % | 19.2% | 21.0% | 31.3% | 2.7% | 26.7% | 17.8% | ||||||
| China | 3.63 | -14.7% | 16.20 | +1.3% | 4.80 | +33.3% | 0.00 | 0.0% | 20.83 | +3.0% | 3.81 | +4.8% |
| Share % | 31.4% | 16.6% | 26.1% | 0.0% | 21.5% | 31.3% | ||||||
| India | 0.56 | +4.6% | 12.40 | +3.3% | 0.00 | 0.0% | 0.00 | 0.0% | 12.43 | +3.8% | 0.54 | -4.4% |
| Share % | 4.8% | 12.7% | 0.0% | 0.0% | 12.9% | 4.4% | ||||||
| Australia | 0.87 | +311.4% | 6.80 | -11.5% | 0.00 | 0.0% | 5.30 | -4.5% | 1.55 | +5.1% | 0.82 | -5.5% |
| Share % | 7.5% | 7.0% | 0.0% | 28.5% | 1.6% | 6.7% | ||||||
| Source: USDA, Last Update: 2026-07-11 | Visit the page with more detailed information | |||||||||||
| Rapeseed - Balance sheet in Mio Tons | Year 2025-26 | ||||||||||||
|---|---|---|---|---|---|---|---|---|---|---|---|---|
| Country | Beginning Stocks | Production | Import | Export | Consumption | Ending Stocks | ||||||
| World | 9.94 | -16.8% | 95.57 | +10.8% | 18.07 | -9.6% | 18.54 | -6.5% | 93.50 | +5.7% | 11.55 | +16.2% |
| Canada | 1.48 | -53.4% | 22.00 | +14.4% | 0.15 | +14.5% | 8.20 | -12.6% | 13.00 | +11.4% | 2.43 | +64.4% |
| Share % | 14.9% | 23.0% | 0.8% | 44.2% | 13.9% | 21.0% | ||||||
| EU-27 | 2.24 | +15.7% | 20.52 | +20.2% | 6.50 | -18.4% | 0.65 | +70.2% | 26.20 | +7.6% | 2.42 | +7.7% |
| Share % | 22.5% | 21.5% | 36.0% | 3.5% | 28.0% | 21.0% | ||||||
| China | 4.26 | -11.0% | 16.00 | +1.3% | 3.60 | -21.7% | 0.00 | 0.0% | 20.23 | -3.3% | 3.63 | -14.7% |
| Share % | 42.9% | 16.7% | 19.9% | 0.0% | 21.6% | 31.4% | ||||||
| India | 0.54 | -5.3% | 12.00 | +4.2% | 0.00 | 0.0% | 0.00 | 0.0% | 11.98 | +3.7% | 0.56 | +4.6% |
| Share % | 5.4% | 12.6% | 0.0% | 0.0% | 12.8% | 4.8% | ||||||
| Australia | 0.21 | -53.7% | 7.68 | +20.1% | 0.00 | +100.0% | 5.55 | +5.1% | 1.48 | +8.5% | 0.87 | +311.4% |
| Share % | 2.1% | 8.0% | 0.0% | 29.9% | 1.6% | 7.5% | ||||||
| Source: USDA, Last Update: 2026-07-11 | Visit the page with more detailed information | |||||||||||
|
Rice
| Balance sheet in Mio Tons
Year 2026-27 (Forecast July)
Prices Rice US
Forecast 2026-27 Increasing Rispetto all'annata 2025-26 |
||||||||||||
|---|---|---|---|---|---|---|---|---|---|---|---|---|
| Country | Beginning Stocks | Production | Import | Export | Consumption | Ending Stocks | ||||||
| World | 198.20 | +3.7% | 537.18 | -1.6% | 60.20 | +5.8% | 62.78 | +4.1% | 540.22 | +0.9% | 192.58 | -2.8% |
| India | 54.00 | +12.5% | 150.00 | -2.6% | 0.00 | 0.0% | 25.00 | +6.4% | 128.00 | +2.8% | 51.00 | -5.6% |
| Share % | 27.2% | 27.9% | 0.0% | 39.8% | 23.7% | 26.5% | ||||||
| China | 105.50 | +1.0% | 147.00 | +0.5% | 3.90 | 0.0% | 2.20 | +10.0% | 147.20 | 0.0% | 107.00 | +1.4% |
| Share % | 53.2% | 27.4% | 6.5% | 3.5% | 27.2% | 55.6% | ||||||
| Bangladesh | 2.18 | +26.0% | 37.40 | -0.7% | 1.60 | +13.5% | 0.01 | 0.0% | 39.00 | +1.0% | 2.17 | -0.5% |
| Share % | 1.1% | 7.0% | 2.7% | 0.0% | 7.2% | 1.1% | ||||||
| Indonesia | 4.58 | -17.9% | 33.60 | -0.6% | 0.50 | 0.0% | 0.00 | 0.0% | 35.00 | -0.8% | 3.68 | -19.7% |
| Share % | 2.3% | 6.3% | 0.8% | 0.0% | 6.5% | 1.9% | ||||||
| Vietnam | 2.50 | -25.4% | 26.10 | -0.4% | 3.80 | +15.2% | 8.10 | 0.0% | 22.20 | -0.2% | 2.10 | -16.0% |
| Share % | 1.3% | 4.9% | 6.3% | 12.9% | 4.1% | 1.1% | ||||||
| Source: USDA - WASDE, Last Update: 2026-07-11 | Visit the page with more detailed information | |||||||||||
| Rice - Balance sheet in Mio Tons | Year 2026-27 (Forecast Giugno) | ||||||||||||
|---|---|---|---|---|---|---|---|---|---|---|---|---|
| Country | Beginning Stocks | Production | Import | Export | Consumption | Ending Stocks | ||||||
| World | 392.47 | +105.3% | 1075.64 | +97.1% | 119.47 | +109.9% | 126.02 | +108.9% | 1076.02 | +101.0% | 385.54 | +94.5% |
| India | 53.00 | +10.4% | 150.00 | -2.6% | 0.00 | 0.0% | 25.00 | +6.4% | 128.00 | +2.8% | 50.00 | -7.4% |
| Share % | 26.7% | 27.9% | 0.0% | 39.8% | 23.7% | 26.0% | ||||||
| China | 105.00 | +0.5% | 147.00 | +0.5% | 3.30 | -15.4% | 2.20 | +10.0% | 145.10 | -1.4% | 108.00 | +2.4% |
| Share % | 53.0% | 27.4% | 5.5% | 3.5% | 26.9% | 56.1% | ||||||
| Bangladesh | 2.19 | +26.9% | 37.40 | -0.7% | 1.70 | +20.6% | 0.01 | 0.0% | 39.10 | +1.3% | 2.18 | +0.2% |
| Share % | 1.1% | 7.0% | 2.8% | 0.0% | 7.2% | 1.1% | ||||||
| Indonesia | 4.58 | -17.9% | 33.60 | -0.6% | 0.50 | 0.0% | 0.00 | 0.0% | 35.00 | -0.8% | 3.68 | -19.7% |
| Share % | 2.3% | 6.3% | 0.8% | 0.0% | 6.5% | 1.9% | ||||||
| Vietnam | 2.40 | -28.4% | 26.10 | -0.4% | 4.00 | +21.2% | 8.00 | -1.2% | 22.40 | +0.7% | 2.20 | -12.0% |
| Share % | 1.2% | 4.9% | 6.6% | 12.7% | 4.1% | 1.1% | ||||||
| Source: USDA, Last Update: 2026-07-11 | Visit the page with more detailed information | |||||||||||
| Rice - Balance sheet in Mio Tons | Year 2025-26 | ||||||||||||
|---|---|---|---|---|---|---|---|---|---|---|---|---|
| Country | Beginning Stocks | Production | Import | Export | Consumption | Ending Stocks | ||||||
| World | 191.13 | +6.4% | 545.73 | +0.6% | 56.91 | -1.8% | 60.33 | -1.9% | 535.26 | +1.5% | 198.20 | +3.7% |
| India | 48.00 | +14.3% | 154.02 | +2.6% | 0.00 | 0.0% | 23.50 | +2.9% | 124.52 | +2.6% | 54.00 | +12.5% |
| Share % | 25.1% | 28.2% | 0.0% | 39.0% | 23.3% | 27.2% | ||||||
| China | 104.50 | +1.5% | 146.33 | +0.7% | 3.90 | +67.0% | 2.00 | +73.5% | 147.23 | +1.6% | 105.50 | +1.0% |
| Share % | 54.7% | 26.8% | 6.9% | 3.3% | 27.5% | 53.2% | ||||||
| Bangladesh | 1.73 | -5.4% | 37.65 | +2.9% | 1.41 | +7.9% | 0.01 | +100.0% | 38.60 | +1.6% | 2.18 | +26.0% |
| Share % | 0.9% | 6.9% | 2.5% | 0.0% | 7.2% | 1.1% | ||||||
| Indonesia | 5.58 | -9.6% | 33.80 | -0.9% | 0.50 | -38.3% | 0.00 | 0.0% | 35.30 | -0.6% | 4.58 | -17.9% |
| Share % | 2.9% | 6.2% | 0.9% | 0.0% | 6.6% | 2.3% | ||||||
| Vietnam | 3.35 | +0.4% | 26.20 | -2.4% | 3.30 | -6.4% | 8.10 | +0.5% | 22.25 | -0.2% | 2.50 | -25.4% |
| Share % | 1.8% | 4.8% | 5.8% | 13.4% | 4.2% | 1.3% | ||||||
| Source: USDA, Last Update: 2026-07-11 | Visit the page with more detailed information | |||||||||||
|
Sorghum
| Balance sheet in Mio Tons
Year 2026-27 (Forecast July)
Prices Sorghum US
Forecast 2026-27 Increasing Rispetto all'annata 2025-26 |
||||||||||||
|---|---|---|---|---|---|---|---|---|---|---|---|---|
| Country | Beginning Stocks | Production | Import | Export | Consumption | Ending Stocks | ||||||
| World | 3.90 | -17.7% | 63.36 | +2.3% | 8.78 | -7.5% | 9.31 | -3.2% | 62.84 | +0.3% | 3.88 | -0.4% |
| United States | 0.94 | -7.8% | 9.65 | -13.0% | 0.00 | 0.0% | 5.21 | -6.8% | 4.45 | -20.5% | 0.94 | 0.0% |
| Share % | 24.1% | 15.2% | 0.0% | 56.0% | 7.1% | 24.2% | ||||||
| Nigeria | 0.14 | +33.3% | 7.00 | +7.7% | 0.02 | +50.0% | 0.05 | 0.0% | 6.90 | +7.4% | 0.21 | +46.4% |
| Share % | 3.6% | 11.0% | 0.2% | 0.5% | 11.0% | 5.4% | ||||||
| Brazil | 0.53 | -12.4% | 6.50 | +4.8% | 0.10 | 0.0% | 0.10 | +33.3% | 6.50 | +3.2% | 0.53 | 0.0% |
| Share % | 13.6% | 10.3% | 1.1% | 1.1% | 10.3% | 13.7% | ||||||
| India | 0.16 | -60.7% | 4.70 | +7.9% | 0.00 | 0.0% | 0.05 | 0.0% | 4.50 | -1.1% | 0.31 | +94.9% |
| Share % | 4.1% | 7.4% | 0.0% | 0.5% | 7.2% | 8.0% | ||||||
| Mexico | 0.18 | -22.2% | 4.15 | +29.7% | 0.30 | -33.3% | 0.00 | 0.0% | 4.40 | +18.9% | 0.23 | +27.4% |
| Share % | 4.6% | 6.5% | 3.4% | 0.0% | 7.0% | 5.9% | ||||||
| Source: USDA - WASDE, Last Update: 2026-07-11 | Visit the page with more detailed information | |||||||||||
| Sorghum - Balance sheet in Mio Tons | Year 2026-27 (Forecast Giugno) | ||||||||||||
|---|---|---|---|---|---|---|---|---|---|---|---|---|
| Country | Beginning Stocks | Production | Import | Export | Consumption | Ending Stocks | ||||||
| World | 7.65 | +61.7% | 125.36 | +102.5% | 17.49 | +84.3% | 18.59 | +93.4% | 124.34 | +98.6% | 7.57 | +94.3% |
| United States | 0.94 | -7.9% | 9.32 | -16.0% | 0.00 | 0.0% | 5.21 | -6.8% | 4.19 | -25.0% | 0.86 | -8.1% |
| Share % | 24.1% | 14.7% | 0.0% | 56.0% | 6.7% | 22.2% | ||||||
| Nigeria | 0.14 | +33.3% | 7.00 | +7.7% | 0.02 | +50.0% | 0.05 | 0.0% | 6.90 | +7.4% | 0.21 | +46.4% |
| Share % | 3.6% | 11.0% | 0.2% | 0.5% | 11.0% | 5.4% | ||||||
| Brazil | 0.43 | -29.0% | 6.50 | +4.8% | 0.10 | 0.0% | 0.10 | +33.3% | 6.40 | +1.6% | 0.53 | 0.0% |
| Share % | 11.0% | 10.3% | 1.1% | 1.1% | 10.2% | 13.7% | ||||||
| India | 0.16 | -60.7% | 4.70 | +7.9% | 0.00 | 0.0% | 0.05 | 0.0% | 4.50 | -1.1% | 0.31 | +94.9% |
| Share % | 4.1% | 7.4% | 0.0% | 0.5% | 7.2% | 8.0% | ||||||
| Mexico | 0.18 | -22.2% | 3.80 | +18.8% | 0.30 | -33.3% | 0.00 | 0.0% | 4.10 | +10.8% | 0.18 | -0.6% |
| Share % | 4.6% | 6.0% | 3.4% | 0.0% | 6.5% | 4.6% | ||||||
| Source: USDA, Last Update: 2026-07-11 | Visit the page with more detailed information | |||||||||||
| Sorghum - Balance sheet in Mio Tons | Year 2025-26 | ||||||||||||
|---|---|---|---|---|---|---|---|---|---|---|---|---|
| Country | Beginning Stocks | Production | Import | Export | Consumption | Ending Stocks | ||||||
| World | 4.73 | +20.1% | 61.92 | -1.2% | 9.49 | +25.2% | 9.62 | +39.5% | 62.62 | +0.1% | 3.90 | -17.7% |
| United States | 1.02 | +22.7% | 11.10 | +27.0% | 0.00 | 0.0% | 5.59 | +124.5% | 5.59 | -7.7% | 0.94 | -7.8% |
| Share % | 21.6% | 17.9% | 0.0% | 58.1% | 8.9% | 24.1% | ||||||
| Nigeria | 0.11 | -13.2% | 6.50 | +1.3% | 0.01 | -41.2% | 0.05 | 0.0% | 6.43 | +0.4% | 0.14 | +33.3% |
| Share % | 2.3% | 10.5% | 0.1% | 0.5% | 10.3% | 3.6% | ||||||
| Brazil | 0.60 | +25.1% | 6.20 | +1.6% | 0.10 | -28.6% | 0.08 | -38.0% | 6.30 | +5.0% | 0.53 | -12.4% |
| Share % | 12.7% | 10.0% | 1.1% | 0.8% | 10.1% | 13.6% | ||||||
| India | 0.40 | +68.2% | 4.36 | -12.1% | 0.00 | 0.0% | 0.05 | +19.0% | 4.55 | -4.2% | 0.16 | -60.7% |
| Share % | 8.5% | 7.0% | 0.0% | 0.5% | 7.3% | 4.1% | ||||||
| Mexico | 0.23 | -14.5% | 3.20 | -23.8% | 0.45 | -19.9% | 0.00 | 0.0% | 3.70 | -22.9% | 0.18 | -22.2% |
| Share % | 4.9% | 5.2% | 4.7% | 0.0% | 5.9% | 4.6% | ||||||
| Source: USDA, Last Update: 2026-07-11 | Visit the page with more detailed information | |||||||||||
| Soybean Meal - Balance sheet in Mio Tons | Year 2026-27 (Forecast July) | ||||||||||||
|---|---|---|---|---|---|---|---|---|---|---|---|---|
| Country | Beginning Stocks | Production | Import | Export | Consumption | Ending Stocks | ||||||
| World | 19.33 | +7.7% | 300.98 | +2.9% | 84.36 | +4.3% | 88.40 | +4.5% | 295.93 | +3.0% | 20.34 | +5.2% |
| China | 1.27 | +34.8% | 87.91 | +1.8% | 0.10 | -33.3% | 1.10 | +10.0% | 86.75 | +1.9% | 1.43 | +12.7% |
| Share % | 6.6% | 29.2% | 0.1% | 1.2% | 29.3% | 7.0% | ||||||
| United States | 0.41 | +13.0% | 58.95 | +3.1% | 0.76 | 0.0% | 19.96 | +8.4% | 39.76 | +0.7% | 0.41 | 0.0% |
| Share % | 2.1% | 19.6% | 0.9% | 22.6% | 13.4% | 2.0% | ||||||
| Brazil | 4.16 | +19.8% | 50.01 | +5.3% | 0.01 | 0.0% | 26.90 | +7.6% | 23.00 | +5.5% | 4.28 | +2.9% |
| Share % | 21.5% | 16.6% | 0.0% | 30.4% | 7.8% | 21.0% | ||||||
| Argentina | 2.73 | -0.4% | 33.11 | +2.4% | 0.12 | -52.0% | 29.40 | +1.4% | 3.65 | +1.4% | 2.91 | +6.6% |
| Share % | 14.1% | 11.0% | 0.1% | 33.3% | 1.2% | 14.3% | ||||||
| EU-27 | 1.47 | -14.6% | 11.46 | -2.0% | 20.20 | +3.1% | 0.60 | 0.0% | 31.04 | +0.3% | 1.48 | +0.9% |
| Share % | 7.6% | 3.8% | 23.9% | 0.7% | 10.5% | 7.3% | ||||||
| Source: USDA - WASDE, Last Update: 2026-07-11 | Visit the page with more detailed information | |||||||||||
| Soybean Meal - Balance sheet in Mio Tons | Year 2026-27 (Forecast Giugno) | ||||||||||||
|---|---|---|---|---|---|---|---|---|---|---|---|---|
| Country | Beginning Stocks | Production | Import | Export | Consumption | Ending Stocks | ||||||
| World | 19.15 | +6.7% | 300.15 | +2.6% | 84.10 | +4.0% | 88.13 | +4.2% | 295.21 | +2.8% | 20.06 | +3.8% |
| China | 1.28 | +35.6% | 87.12 | +0.9% | 0.10 | -33.3% | 1.10 | +10.0% | 85.95 | +0.9% | 1.45 | +14.0% |
| Share % | 6.6% | 28.9% | 0.1% | 1.2% | 29.0% | 7.1% | ||||||
| United States | 0.41 | +13.0% | 58.99 | +3.2% | 0.73 | -4.7% | 19.69 | +6.9% | 40.03 | +1.4% | 0.41 | 0.0% |
| Share % | 2.1% | 19.6% | 0.9% | 22.3% | 13.5% | 2.0% | ||||||
| Brazil | 4.16 | +19.8% | 50.01 | +5.3% | 0.01 | 0.0% | 26.90 | +7.6% | 23.00 | +5.5% | 4.28 | +2.9% |
| Share % | 21.5% | 16.6% | 0.0% | 30.4% | 7.8% | 21.0% | ||||||
| Argentina | 2.73 | -0.4% | 33.11 | +2.4% | 0.12 | -52.0% | 29.40 | +1.4% | 3.65 | +1.4% | 2.91 | +6.6% |
| Share % | 14.1% | 11.0% | 0.1% | 33.3% | 1.2% | 14.3% | ||||||
| EU-27 | 1.47 | -14.6% | 11.46 | -2.0% | 20.20 | +3.1% | 0.60 | 0.0% | 31.04 | +0.3% | 1.48 | +0.9% |
| Share % | 7.6% | 3.8% | 23.9% | 0.7% | 10.5% | 7.3% | ||||||
| Source: USDA, Last Update: 2026-07-11 | Visit the page with more detailed information | |||||||||||
| Soybean Meal - Balance sheet in Mio Tons | Year 2025-26 | ||||||||||||
|---|---|---|---|---|---|---|---|---|---|---|---|---|
| Country | Beginning Stocks | Production | Import | Export | Consumption | Ending Stocks | ||||||
| World | 17.94 | +25.4% | 292.43 | +3.8% | 80.84 | +4.1% | 84.62 | +2.1% | 287.27 | +5.3% | 19.33 | +7.7% |
| China | 0.94 | +18.8% | 86.33 | +5.3% | 0.15 | +233.3% | 1.00 | -1.8% | 85.15 | +5.3% | 1.27 | +34.8% |
| Share % | 5.2% | 29.5% | 0.2% | 1.2% | 29.6% | 6.6% | ||||||
| United States | 0.36 | -12.2% | 57.19 | +7.9% | 0.76 | +4.1% | 18.42 | +12.3% | 39.49 | +5.6% | 0.41 | +13.0% |
| Share % | 2.0% | 19.6% | 0.9% | 21.8% | 13.7% | 2.1% | ||||||
| Brazil | 3.47 | +16.8% | 47.48 | +7.0% | 0.01 | +100.0% | 25.00 | +6.9% | 21.80 | +6.3% | 4.16 | +19.8% |
| Share % | 19.3% | 16.2% | 0.0% | 29.5% | 7.6% | 21.5% | ||||||
| Argentina | 2.74 | +21.3% | 32.34 | -3.5% | 0.25 | -10.4% | 29.00 | -2.6% | 3.60 | +2.1% | 2.73 | -0.4% |
| Share % | 15.3% | 11.1% | 0.3% | 34.3% | 1.3% | 14.1% | ||||||
| EU-27 | 1.72 | +105.4% | 11.69 | -3.9% | 19.60 | -4.9% | 0.60 | -8.0% | 30.94 | -1.0% | 1.47 | -14.6% |
| Share % | 9.6% | 4.0% | 24.2% | 0.7% | 10.8% | 7.6% | ||||||
| Source: USDA, Last Update: 2026-07-11 | Visit the page with more detailed information | |||||||||||
| Sunflower Meal - Balance sheet in Mio Tons | Year 2026-27 (Forecast July) | ||||||||||||
|---|---|---|---|---|---|---|---|---|---|---|---|---|
| Country | Beginning Stocks | Production | Import | Export | Consumption | Ending Stocks | ||||||
| World | 1.96 | +1.8% | 24.85 | +11.7% | 9.24 | +13.1% | 10.25 | +17.0% | 23.61 | +9.1% | 2.20 | +12.1% |
| Russia | 0.48 | +16.3% | 7.68 | +12.0% | 0.01 | 0.0% | 2.80 | +21.7% | 4.85 | +7.8% | 0.52 | +8.2% |
| Share % | 24.5% | 30.9% | 0.1% | 27.3% | 20.5% | 23.6% | ||||||
| Ukraine | 0.33 | -22.6% | 5.20 | +14.5% | 0.01 | 0.0% | 3.30 | +13.8% | 1.88 | +7.1% | 0.37 | +11.7% |
| Share % | 16.8% | 20.9% | 0.1% | 32.2% | 8.0% | 16.8% | ||||||
| EU-27 | 0.40 | +1.5% | 4.92 | +21.0% | 2.70 | +3.8% | 0.90 | +80.0% | 6.71 | +8.9% | 0.41 | +2.3% |
| Share % | 20.4% | 19.8% | 29.2% | 8.8% | 28.4% | 18.6% | ||||||
| Argentina | 0.23 | +18.6% | 2.69 | +6.1% | 0.00 | 0.0% | 2.00 | +5.3% | 0.63 | +4.2% | 0.30 | +28.3% |
| Share % | 11.7% | 10.8% | 0.0% | 19.5% | 2.7% | 13.6% | ||||||
| Turkey | 0.21 | +24.0% | 1.27 | -3.1% | 1.08 | +19.4% | 0.08 | +15.4% | 2.25 | +7.1% | 0.23 | +7.1% |
| Share % | 10.7% | 5.1% | 11.7% | 0.8% | 9.5% | 10.5% | ||||||
| Source: USDA - WASDE, Last Update: 2026-07-11 | Visit the page with more detailed information | |||||||||||
| Sunflower Meal - Balance sheet in Mio Tons | Year 2026-27 (Forecast Giugno) | ||||||||||||
|---|---|---|---|---|---|---|---|---|---|---|---|---|
| Country | Beginning Stocks | Production | Import | Export | Consumption | Ending Stocks | ||||||
| World | 1.97 | +2.0% | 24.76 | +11.2% | 9.24 | +13.1% | 10.40 | +18.8% | 23.36 | +8.0% | 2.21 | +12.5% |
| Russia | 0.48 | +16.3% | 7.48 | +9.0% | 0.01 | 0.0% | 2.80 | +21.7% | 4.65 | +3.3% | 0.51 | +6.9% |
| Share % | 24.5% | 30.1% | 0.1% | 27.3% | 19.7% | 23.2% | ||||||
| Ukraine | 0.33 | -22.6% | 5.41 | +19.1% | 0.01 | 0.0% | 3.50 | +20.7% | 1.88 | +7.1% | 0.38 | +13.6% |
| Share % | 16.8% | 21.8% | 0.1% | 34.1% | 8.0% | 17.3% | ||||||
| EU-27 | 0.40 | +1.5% | 4.87 | +19.7% | 2.70 | +3.8% | 0.90 | +80.0% | 6.66 | +8.1% | 0.40 | +1.3% |
| Share % | 20.4% | 19.6% | 29.2% | 8.8% | 28.2% | 18.2% | ||||||
| Argentina | 0.23 | +18.6% | 2.69 | +6.1% | 0.00 | 0.0% | 2.00 | +5.3% | 0.63 | +4.2% | 0.30 | +28.3% |
| Share % | 11.7% | 10.8% | 0.0% | 19.5% | 2.7% | 13.6% | ||||||
| Turkey | 0.23 | +32.7% | 1.27 | -3.1% | 1.08 | +19.4% | 0.08 | +15.4% | 2.25 | +7.1% | 0.24 | +14.2% |
| Share % | 11.7% | 5.1% | 11.7% | 0.8% | 9.5% | 10.9% | ||||||
| Source: USDA, Last Update: 2026-07-11 | Visit the page with more detailed information | |||||||||||
| Sunflower Meal - Balance sheet in Mio Tons | Year 2025-26 | ||||||||||||
|---|---|---|---|---|---|---|---|---|---|---|---|---|
| Country | Beginning Stocks | Production | Import | Export | Consumption | Ending Stocks | ||||||
| World | 1.93 | -9.4% | 22.26 | +4.0% | 8.17 | +5.5% | 8.76 | -0.1% | 21.64 | +5.1% | 1.96 | +1.8% |
| Russia | 0.41 | +0.7% | 6.86 | +2.4% | 0.01 | 0.0% | 2.30 | -4.2% | 4.50 | +4.7% | 0.48 | +16.3% |
| Share % | 21.2% | 30.8% | 0.1% | 26.3% | 20.8% | 24.5% | ||||||
| Ukraine | 0.43 | -24.2% | 4.54 | -10.6% | 0.01 | +900.0% | 2.90 | -15.2% | 1.75 | -2.8% | 0.33 | -22.6% |
| Share % | 22.3% | 20.4% | 0.1% | 33.1% | 8.1% | 16.8% | ||||||
| EU-27 | 0.39 | -14.0% | 4.07 | -1.0% | 2.60 | +1.3% | 0.50 | +4.4% | 6.16 | -1.6% | 0.40 | +1.5% |
| Share % | 20.2% | 18.3% | 31.8% | 5.7% | 28.5% | 20.4% | ||||||
| Argentina | 0.19 | -5.8% | 2.54 | +18.2% | 0.00 | 0.0% | 1.90 | +14.7% | 0.60 | +20.0% | 0.23 | +18.6% |
| Share % | 9.8% | 11.4% | 0.0% | 21.7% | 2.8% | 11.7% | ||||||
| Turkey | 0.17 | -8.6% | 1.31 | +31.3% | 0.90 | -13.6% | 0.07 | +22.6% | 2.10 | +5.0% | 0.21 | +24.0% |
| Share % | 8.8% | 5.9% | 11.0% | 0.8% | 9.7% | 10.7% | ||||||
| Source: USDA, Last Update: 2026-07-11 | Visit the page with more detailed information | |||||||||||
| Oats - Balance sheet in Mio Tons | Year 2026-27 (Forecast July) | ||||||||||||
|---|---|---|---|---|---|---|---|---|---|---|---|---|
| Country | Beginning Stocks | Production | Import | Export | Consumption | Ending Stocks | ||||||
| World | 3.74 | +45.1% | 23.07 | -9.4% | 2.61 | -1.1% | 2.65 | -6.8% | 23.34 | -3.2% | 3.44 | -8.2% |
| EU-27 | 1.28 | +128.1% | 8.00 | -10.3% | 0.08 | +50.0% | 0.15 | -14.3% | 8.00 | -0.9% | 1.21 | -5.9% |
| Share % | 34.2% | 34.7% | 3.1% | 5.7% | 34.3% | 35.2% | ||||||
| Russia | 0.15 | +50.5% | 3.30 | -13.2% | 0.00 | 0.0% | 0.25 | -16.7% | 3.05 | -11.6% | 0.15 | 0.0% |
| Share % | 4.0% | 14.3% | 0.0% | 9.4% | 13.1% | 4.4% | ||||||
| Canada | 0.84 | +66.1% | 3.10 | -20.9% | 0.02 | 0.0% | 1.40 | -3.4% | 1.95 | -9.3% | 0.61 | -27.9% |
| Share % | 22.5% | 13.4% | 0.8% | 52.8% | 8.4% | 17.7% | ||||||
| Australia | 0.35 | +14.9% | 1.80 | +6.2% | 0.00 | 0.0% | 0.70 | 0.0% | 1.05 | +10.5% | 0.40 | +14.4% |
| Share % | 9.4% | 7.8% | 0.0% | 26.4% | 4.5% | 11.6% | ||||||
| Brazil | 0.07 | +10.6% | 1.15 | -11.0% | 0.00 | 0.0% | 0.01 | -50.0% | 1.13 | -11.8% | 0.09 | +27.4% |
| Share % | 1.9% | 5.0% | 0.0% | 0.4% | 4.8% | 2.6% | ||||||
| Source: USDA - WASDE, Last Update: 2026-07-11 | Visit the page with more detailed information | |||||||||||
| Oats - Balance sheet in Mio Tons | Year 2026-27 (Forecast Giugno) | ||||||||||||
|---|---|---|---|---|---|---|---|---|---|---|---|---|
| Country | Beginning Stocks | Production | Import | Export | Consumption | Ending Stocks | ||||||
| World | 7.48 | +189.7% | 45.91 | +80.2% | 5.16 | +95.7% | 5.20 | +83.0% | 46.50 | +92.9% | 6.84 | +82.7% |
| EU-27 | 1.31 | +132.6% | 8.00 | -10.3% | 0.08 | +50.0% | 0.15 | -14.3% | 8.00 | -0.9% | 1.23 | -3.9% |
| Share % | 35.0% | 34.7% | 3.1% | 5.7% | 34.3% | 35.8% | ||||||
| Russia | 0.15 | +50.5% | 3.30 | -13.2% | 0.00 | 0.0% | 0.25 | -16.7% | 3.05 | -11.6% | 0.15 | 0.0% |
| Share % | 4.0% | 14.3% | 0.0% | 9.4% | 13.1% | 4.4% | ||||||
| Canada | 0.84 | +66.1% | 3.30 | -15.8% | 0.02 | 0.0% | 1.40 | -3.4% | 2.05 | -4.7% | 0.71 | -16.0% |
| Share % | 22.5% | 14.3% | 0.8% | 52.8% | 8.8% | 20.6% | ||||||
| Australia | 0.35 | +14.9% | 1.80 | +6.2% | 0.00 | 0.0% | 0.70 | 0.0% | 1.05 | +10.5% | 0.40 | +14.4% |
| Share % | 9.4% | 7.8% | 0.0% | 26.4% | 4.5% | 11.6% | ||||||
| Brazil | 0.07 | +10.6% | 1.15 | -11.0% | 0.00 | 0.0% | 0.01 | -50.0% | 1.13 | -11.8% | 0.09 | +27.4% |
| Share % | 1.9% | 5.0% | 0.0% | 0.4% | 4.8% | 2.6% | ||||||
| Source: USDA, Last Update: 2026-07-11 | Visit the page with more detailed information | |||||||||||
| Oats - Balance sheet in Mio Tons | Year 2025-26 | ||||||||||||
|---|---|---|---|---|---|---|---|---|---|---|---|---|
| Country | Beginning Stocks | Production | Import | Export | Consumption | Ending Stocks | ||||||
| World | 2.58 | +0.5% | 25.47 | +13.3% | 2.64 | +4.6% | 2.84 | +2.5% | 24.11 | +8.4% | 3.74 | +45.1% |
| EU-27 | 0.56 | +122.1% | 8.92 | +16.1% | 0.05 | -21.9% | 0.18 | +92.3% | 8.08 | +9.9% | 1.28 | +128.1% |
| Share % | 21.7% | 35.0% | 1.9% | 6.3% | 33.5% | 34.2% | ||||||
| Russia | 0.10 | -33.6% | 3.80 | +26.7% | 0.00 | 0.0% | 0.30 | 0.0% | 3.45 | +25.5% | 0.15 | +50.5% |
| Share % | 3.9% | 14.9% | 0.0% | 10.6% | 14.3% | 4.0% | ||||||
| Canada | 0.51 | -24.3% | 3.92 | +16.7% | 0.02 | -11.8% | 1.45 | -11.7% | 2.15 | +13.4% | 0.84 | +66.1% |
| Share % | 19.8% | 15.4% | 0.8% | 51.1% | 8.9% | 22.5% | ||||||
| Australia | 0.30 | -7.4% | 1.70 | +28.9% | 0.00 | 0.0% | 0.70 | +25.2% | 0.95 | +21.8% | 0.35 | +14.9% |
| Share % | 11.6% | 6.7% | 0.0% | 24.6% | 3.9% | 9.4% | ||||||
| Brazil | 0.07 | -18.5% | 1.29 | +24.0% | 0.00 | -100.0% | 0.01 | +25.0% | 1.28 | +21.4% | 0.07 | +10.6% |
| Share % | 2.7% | 5.1% | 0.0% | 0.4% | 5.3% | 1.9% | ||||||
| Source: USDA, Last Update: 2026-07-11 | Visit the page with more detailed information | |||||||||||
Show the data of:
Previous season
Current season
| Previous forecast
| Current forecast
Show the data of:
Previous season
Current season
| Previous forecast
| Current forecast
| Live Swine - Balance sheet in Mio capi | Year 2026 (Forecast April) | |||||||||||||||
|---|---|---|---|---|---|---|---|---|---|---|---|---|---|---|---|
| Country | Beginning Stocks | Production | Import | Export | SLAUGHTERS | Losses | Ending Stocks | ||||||||
| World |
Login to consult this balance
The login can be done from the bar at the top of the page, by clicking on "Login" on the right, next to the flags. Don't Have an Account? Click here to sign up. |
||||||||||||||
| China | |||||||||||||||
| EU-27 | |||||||||||||||
| United States | |||||||||||||||
| Russia | |||||||||||||||
| Brazil | |||||||||||||||
| Source: USDA, Last Update: 2026-04-13 | Visit the page with more detailed information | ||||||||||||||
| Pork Meat - Balance sheet in Mio Tons | Year 2026 (Forecast April) | |||||||||||||
|---|---|---|---|---|---|---|---|---|---|---|---|---|---|
| Country | Beginning Stocks | Production | Import | Export | Consumption | Ending Stocks | |||||||
| World |
Login to consult this balance
The login can be done from the bar at the top of the page, by clicking on "Login" on the right, next to the flags. Don't Have an Account? Click here to sign up. |
||||||||||||
| China | |||||||||||||
| EU-27 | |||||||||||||
| United States | |||||||||||||
| Brazil | |||||||||||||
| Russia | |||||||||||||
| Source: USDA, Last Update: 2026-04-13 | Visit the page with more detailed information | ||||||||||||
Show the data of:
Previous season
Current season
Show the data of:
Previous season
Current season
| Live Bovine - Balance sheet in Mio capi | Year 2026 (Forecast April) | |||||||||||||||
|---|---|---|---|---|---|---|---|---|---|---|---|---|---|---|---|
| Country | Beginning Stocks | Production | Import | Export | SLAUGHTERS | Losses | Ending Stocks | ||||||||
| World |
Login to consult this balance
The login can be done from the bar at the top of the page, by clicking on "Login" on the right, next to the flags. Don't Have an Account? Click here to sign up. |
||||||||||||||
| India | |||||||||||||||
| Brazil | |||||||||||||||
| China | |||||||||||||||
| United States | |||||||||||||||
| EU-27 | |||||||||||||||
| Source: USDA, Last Update: 2026-04-13 | Visit the page with more detailed information | ||||||||||||||
| Bovines Meat - Balance sheet in Mio Tons | Year 2026 (Forecast April) | |||||||||||||
|---|---|---|---|---|---|---|---|---|---|---|---|---|---|
| Country | Beginning Stocks | Production | Import | Export | Consumption | Ending Stocks | |||||||
| World |
Login to consult this balance
The login can be done from the bar at the top of the page, by clicking on "Login" on the right, next to the flags. Don't Have an Account? Click here to sign up. |
||||||||||||
| Brazil | |||||||||||||
| United States | |||||||||||||
| China | |||||||||||||
| EU-27 | |||||||||||||
| India | |||||||||||||
| Source: USDA, Last Update: 2026-04-13 | Visit the page with more detailed information | ||||||||||||
Show the data of:
Previous season
Current season
| Chicken Meat - Balance sheet in Mio tons | Year 2026 (Forecast April) | |||||||||||||
|---|---|---|---|---|---|---|---|---|---|---|---|---|---|
| Country | Beginning Stocks | Production | Import | Export | Consumption | Ending Stocks | |||||||
| World |
Login to consult this balance
The login can be done from the bar at the top of the page, by clicking on "Login" on the right, next to the flags. Don't Have an Account? Click here to sign up. |
||||||||||||
| United States | |||||||||||||
| China | |||||||||||||
| Brazil | |||||||||||||
| EU-27 | |||||||||||||
| Russia | |||||||||||||
| Source: USDA, Last Update: 2026-04-13 | |||||||||||||
Show the data of:
Previous season
Current season
| Previous forecast
| Current forecast
Show the data of:
Previous season
Current season
Show the data of:
Previous season
Current season
| Previous forecast
| Current forecast
| Almonds - Balance sheet in Tons x 1000 | Year 2025-26 (Forecast February) | |||||||||||||
|---|---|---|---|---|---|---|---|---|---|---|---|---|---|
| Country | Beginning Stocks | Production | Import | Export | Consumption | Ending Stocks | |||||||
| World |
Login to consult this balance
The login can be done from the bar at the top of the page, by clicking on "Login" on the right, next to the flags. Don't Have an Account? Click here to sign up. |
||||||||||||
| United States | |||||||||||||
| EU-28 | |||||||||||||
| Australia | |||||||||||||
| Turkey | |||||||||||||
| China | |||||||||||||
| Source: USDA, Last Update: 2026-02-19 | |||||||||||||
| Pistachios - Balance sheet in Tons x 1000 | Year 2025-26 (Forecast February) | |||||||||||||
|---|---|---|---|---|---|---|---|---|---|---|---|---|---|
| Country | Beginning Stocks | Production | Import | Export | Consumption | Ending Stocks | |||||||
| World |
Login to consult this balance
The login can be done from the bar at the top of the page, by clicking on "Login" on the right, next to the flags. Don't Have an Account? Click here to sign up. |
||||||||||||
| United States | |||||||||||||
| Iran | |||||||||||||
| Turkey | |||||||||||||
| EU-28 | |||||||||||||
| Syria | |||||||||||||
| Source: USDA, Last Update: 2026-02-19 | |||||||||||||
| Walnuts - Balance sheet in Tons x 1000 | Year 2025-26 (Forecast February) | |||||||||||||
|---|---|---|---|---|---|---|---|---|---|---|---|---|---|
| Country | Beginning Stocks | Production | Import | Export | Consumption | Ending Stocks | |||||||
| World |
Login to consult this balance
The login can be done from the bar at the top of the page, by clicking on "Login" on the right, next to the flags. Don't Have an Account? Click here to sign up. |
||||||||||||
| China | |||||||||||||
| United States | |||||||||||||
| Chile | |||||||||||||
| EU-28 | |||||||||||||
| Ukraine | |||||||||||||
| Source: USDA, Last Update: 2026-02-19 | |||||||||||||
Show the data of:
Annata precedente
Current season
| Previous forecast
| Current forecast
Show the data of:
Annata precedente
Current season
| Previous forecast
| Current forecast
Show the data of:
Annata precedente
Current season
| Previous forecast
| Current forecast
Show the data of:
Annata precedente
Current season
| Previous forecast
| Current forecast
Show the data of:
Annata precedente
Current season
| Previous forecast
| Current forecast
Show the data of:
Annata precedente
Current season
| Previous forecast
| Current forecast
Show the data of:
Annata precedente
Current season
| Previous forecast
| Current forecast
Show the data of:
Annata precedente
Current season
| Previous forecast
| Current forecast
Show the data of:
Annata precedente
Current season
| Previous forecast
| Current forecast
| Coconut Oil - Balance sheet in Mio Tons | Year 2026-27 (Forecast July) | ||||||||||||
|---|---|---|---|---|---|---|---|---|---|---|---|---|
| Country | Beginning Stocks | Production | Import | Export | Consumption | Ending Stocks | ||||||
| World | 0.73 | -3.1% | 3.82 | +3.5% | 1.84 | -3.5% | 2.11 | +6.8% | 3.61 | -1.1% | 0.68 | -7.1% |
| Philippines | 0.12 | +48.2% | 1.78 | +8.2% | 0.09 | 0.0% | 1.20 | +11.6% | 0.66 | +6.5% | 0.13 | +8.1% |
| Share % | 16.4% | 46.6% | 4.9% | 56.9% | 18.3% | 19.1% | ||||||
| Indonesia | 0.23 | -2.9% | 1.04 | +0.7% | 0.06 | +83.3% | 0.68 | +7.9% | 0.45 | +2.3% | 0.20 | -15.0% |
| Share % | 31.5% | 27.2% | 3.3% | 32.2% | 12.5% | 29.4% | ||||||
| India | 0.09 | -8.6% | 0.57 | 0.0% | 0.00 | 0.0% | 0.02 | -16.7% | 0.56 | -0.9% | 0.09 | 0.0% |
| Share % | 12.3% | 14.9% | 0.0% | 0.9% | 15.5% | 13.2% | ||||||
| Vietnam | 0.01 | 0.0% | 0.20 | +0.5% | 0.00 | 0.0% | 0.02 | 0.0% | 0.18 | +0.5% | 0.01 | 0.0% |
| Share % | 1.4% | 5.2% | 0.0% | 0.9% | 5.0% | 1.5% | ||||||
| Papua New Guinea | 0.01 | -10.0% | 0.05 | -3.9% | 0.00 | 0.0% | 0.04 | -4.8% | 0.01 | 0.0% | 0.01 | -11.1% |
| Share % | 1.4% | 1.3% | 0.0% | 1.9% | 0.3% | 1.5% | ||||||
| Source: USDA, Last Update: 2026-07-11 | ||||||||||||
| Coconut Oil - Balance sheet in Mio Tons | Year 2026-27 (Forecast Giugno) | ||||||||||||
|---|---|---|---|---|---|---|---|---|---|---|---|---|
| Country | Beginning Stocks | Production | Import | Export | Consumption | Ending Stocks | ||||||
| World | 0.73 | -2.7% | 3.82 | +3.5% | 1.84 | -3.5% | 2.11 | +6.8% | 3.61 | -1.1% | 0.68 | -6.7% |
| Philippines | 0.12 | +48.2% | 1.78 | +8.2% | 0.09 | 0.0% | 1.20 | +11.6% | 0.66 | +6.5% | 0.13 | +8.1% |
| Share % | 16.4% | 46.6% | 4.9% | 56.9% | 18.3% | 19.1% | ||||||
| Indonesia | 0.23 | -2.9% | 1.04 | +0.7% | 0.06 | +83.3% | 0.68 | +7.9% | 0.45 | +2.3% | 0.20 | -15.0% |
| Share % | 31.5% | 27.2% | 3.3% | 32.2% | 12.5% | 29.4% | ||||||
| India | 0.09 | -7.5% | 0.57 | 0.0% | 0.00 | 0.0% | 0.02 | -16.7% | 0.56 | -0.9% | 0.09 | +1.2% |
| Share % | 12.3% | 14.9% | 0.0% | 0.9% | 15.5% | 13.2% | ||||||
| Vietnam | 0.01 | 0.0% | 0.20 | +0.5% | 0.00 | 0.0% | 0.02 | 0.0% | 0.18 | +0.5% | 0.01 | 0.0% |
| Share % | 1.4% | 5.2% | 0.0% | 0.9% | 5.0% | 1.5% | ||||||
| Papua New Guinea | 0.01 | +10.0% | 0.05 | -3.9% | 0.00 | 0.0% | 0.04 | -4.8% | 0.01 | 0.0% | 0.01 | +11.1% |
| Share % | 1.4% | 1.3% | 0.0% | 1.9% | 0.3% | 1.5% | ||||||
| Source: USDA, Last Update: 2026-07-11 | ||||||||||||
| Coconut Oil - Balance sheet in Mio Tons | Year 2025-26 | ||||||||||||
|---|---|---|---|---|---|---|---|---|---|---|---|---|
| Country | Beginning Stocks | Production | Import | Export | Consumption | Ending Stocks | ||||||
| World | 0.75 | -11.8% | 3.70 | -3.6% | 1.91 | +2.6% | 1.97 | -11.9% | 3.65 | +2.7% | 0.73 | -2.7% |
| Philippines | 0.08 | -25.9% | 1.64 | -8.3% | 0.09 | -2.2% | 1.08 | -23.2% | 0.62 | +20.6% | 0.12 | +48.2% |
| Share % | 10.7% | 44.3% | 4.7% | 54.8% | 17.0% | 16.4% | ||||||
| Indonesia | 0.24 | +25.0% | 1.03 | +0.1% | 0.03 | -37.5% | 0.63 | +10.1% | 0.44 | -4.3% | 0.23 | -2.9% |
| Share % | 32.0% | 27.8% | 1.6% | 32.0% | 12.1% | 31.5% | ||||||
| India | 0.09 | -10.6% | 0.57 | 0.0% | 0.00 | -100.0% | 0.02 | 0.0% | 0.56 | -0.9% | 0.09 | -8.6% |
| Share % | 12.0% | 15.4% | 0.0% | 1.0% | 15.3% | 12.3% | ||||||
| Vietnam | 0.01 | 0.0% | 0.19 | +1.0% | 0.00 | -20.0% | 0.02 | -6.3% | 0.18 | +1.1% | 0.01 | 0.0% |
| Share % | 1.3% | 5.1% | 0.0% | 1.0% | 4.9% | 1.4% | ||||||
| Papua New Guinea | 0.01 | -16.7% | 0.05 | 0.0% | 0.00 | 0.0% | 0.04 | -2.3% | 0.01 | 0.0% | 0.01 | -10.0% |
| Share % | 1.3% | 1.4% | 0.0% | 2.0% | 0.3% | 1.4% | ||||||
| Source: USDA, Last Update: 2026-07-11 | ||||||||||||
| Cottonseed Oil - Balance sheet in Mio Tons | Year 2026-27 (Forecast July) | ||||||||||||
|---|---|---|---|---|---|---|---|---|---|---|---|---|
| Country | Beginning Stocks | Production | Import | Export | Consumption | Ending Stocks | ||||||
| World | 0.18 | +2.2% | 4.49 | -4.7% | 0.08 | -13.2% | 0.06 | -16.2% | 4.51 | -4.5% | 0.18 | -2.2% |
| India | 0.03 | -10.7% | 1.30 | 0.0% | 0.01 | 0.0% | 0.00 | 0.0% | 1.30 | -0.4% | 0.03 | +8.0% |
| Share % | 16.7% | 29.0% | 12.5% | 0.0% | 28.8% | 16.7% | ||||||
| China | 0.00 | 0.0% | 1.16 | 0.0% | 0.00 | 0.0% | 0.01 | -53.3% | 1.16 | +0.7% | 0.00 | 0.0% |
| Share % | 0.0% | 25.8% | 0.0% | 16.7% | 25.7% | 0.0% | ||||||
| Brazil | 0.05 | -5.8% | 0.83 | -2.7% | 0.01 | 0.0% | 0.01 | 0.0% | 0.84 | -2.9% | 0.05 | -2.0% |
| Share % | 27.8% | 18.5% | 12.5% | 16.7% | 18.6% | 27.8% | ||||||
| Pakistan | 0.02 | -9.5% | 0.32 | -4.7% | 0.00 | 0.0% | 0.00 | 0.0% | 0.33 | -4.4% | 0.02 | -15.8% |
| Share % | 11.1% | 7.1% | 0.0% | 0.0% | 7.3% | 11.1% | ||||||
| Uzbekistan | 0.05 | +25.0% | 0.20 | -2.0% | 0.01 | 0.0% | 0.00 | 0.0% | 0.21 | +2.5% | 0.05 | +2.0% |
| Share % | 27.8% | 4.5% | 12.5% | 0.0% | 4.7% | 27.8% | ||||||
| Source: USDA, Last Update: 2026-07-11 | ||||||||||||
| Cottonseed Oil - Balance sheet in Mio Tons | Year 2026-27 (Forecast Giugno) | ||||||||||||
|---|---|---|---|---|---|---|---|---|---|---|---|---|
| Country | Beginning Stocks | Production | Import | Export | Consumption | Ending Stocks | ||||||
| World | 0.20 | +10.1% | 4.46 | -5.3% | 0.08 | -13.2% | 0.06 | -16.2% | 4.49 | -4.9% | 0.18 | +0.5% |
| India | 0.03 | -10.7% | 1.30 | 0.0% | 0.01 | 0.0% | 0.00 | 0.0% | 1.30 | -0.4% | 0.03 | +8.0% |
| Share % | 15.0% | 29.1% | 12.5% | 0.0% | 29.0% | 16.7% | ||||||
| China | 0.00 | 0.0% | 1.16 | 0.0% | 0.00 | 0.0% | 0.01 | -53.3% | 1.16 | +0.7% | 0.00 | 0.0% |
| Share % | 0.0% | 26.0% | 0.0% | 16.7% | 25.8% | 0.0% | ||||||
| Brazil | 0.06 | +21.2% | 0.83 | -3.6% | 0.01 | 0.0% | 0.01 | 0.0% | 0.84 | -2.9% | 0.05 | +10.2% |
| Share % | 30.0% | 18.6% | 12.5% | 16.7% | 18.7% | 27.8% | ||||||
| Pakistan | 0.02 | -9.5% | 0.32 | -4.7% | 0.00 | 0.0% | 0.00 | 0.0% | 0.33 | -4.4% | 0.02 | -15.8% |
| Share % | 10.0% | 7.2% | 0.0% | 0.0% | 7.3% | 11.1% | ||||||
| Uzbekistan | 0.05 | +25.0% | 0.20 | -3.9% | 0.01 | 0.0% | 0.00 | 0.0% | 0.21 | +2.5% | 0.05 | -6.0% |
| Share % | 25.0% | 4.5% | 12.5% | 0.0% | 4.7% | 27.8% | ||||||
| Source: USDA, Last Update: 2026-07-11 | ||||||||||||
| Cottonseed Oil - Balance sheet in Mio Tons | Year 2025-26 | ||||||||||||
|---|---|---|---|---|---|---|---|---|---|---|---|---|
| Country | Beginning Stocks | Production | Import | Export | Consumption | Ending Stocks | ||||||
| World | 0.18 | -5.3% | 4.71 | -0.1% | 0.09 | +40.0% | 0.07 | +29.8% | 4.72 | -0.2% | 0.18 | +2.2% |
| India | 0.03 | -39.1% | 1.30 | -1.1% | 0.01 | +400.0% | 0.00 | 0.0% | 1.31 | -1.9% | 0.03 | -10.7% |
| Share % | 16.7% | 27.6% | 11.1% | 0.0% | 27.8% | 16.7% | ||||||
| China | 0.00 | 0.0% | 1.16 | 0.0% | 0.00 | 0.0% | 0.02 | +87.5% | 1.15 | -0.6% | 0.00 | 0.0% |
| Share % | 0.0% | 24.6% | 0.0% | 28.6% | 24.4% | 0.0% | ||||||
| Brazil | 0.05 | +36.8% | 0.86 | +6.5% | 0.01 | -28.6% | 0.01 | +66.7% | 0.86 | +8.2% | 0.05 | -5.8% |
| Share % | 27.8% | 18.3% | 11.1% | 14.3% | 18.2% | 27.8% | ||||||
| Pakistan | 0.02 | -25.0% | 0.34 | -1.5% | 0.00 | 0.0% | 0.00 | 0.0% | 0.34 | -2.9% | 0.02 | -9.5% |
| Share % | 11.1% | 7.2% | 0.0% | 0.0% | 7.2% | 11.1% | ||||||
| Uzbekistan | 0.04 | +17.6% | 0.20 | +13.3% | 0.01 | +200.0% | 0.00 | -100.0% | 0.20 | +14.3% | 0.05 | +25.0% |
| Share % | 22.2% | 4.2% | 11.1% | 0.0% | 4.2% | 27.8% | ||||||
| Source: USDA, Last Update: 2026-07-11 | ||||||||||||
| Olive Oil - Balance sheet in Mio Tons | Year 2026-27 (Forecast July) | ||||||||||||
|---|---|---|---|---|---|---|---|---|---|---|---|---|
| Country | Beginning Stocks | Production | Import | Export | Consumption | Ending Stocks | ||||||
| World | 0.61 | +21.6% | 3.25 | -0.9% | 1.28 | +0.5% | 1.39 | -0.4% | 3.11 | +2.3% | 0.63 | +3.6% |
| EU-27 | 0.33 | +28.3% | 2.10 | +0.4% | 0.23 | -10.0% | 0.85 | +6.2% | 1.47 | 0.0% | 0.33 | +1.5% |
| Share % | 54.1% | 64.6% | 18.0% | 61.2% | 47.3% | 52.4% | ||||||
| Turkey | 0.04 | -33.3% | 0.40 | +90.5% | 0.03 | 0.0% | 0.15 | +150.0% | 0.22 | +10.0% | 0.10 | +150.0% |
| Share % | 6.6% | 12.3% | 2.3% | 10.8% | 7.1% | 15.9% | ||||||
| Tunisia | 0.05 | +125.0% | 0.25 | -46.8% | 0.00 | 0.0% | 0.24 | -40.0% | 0.04 | -12.5% | 0.03 | -46.3% |
| Share % | 8.2% | 7.7% | 0.0% | 17.3% | 1.3% | 4.8% | ||||||
| Morocco | 0.02 | +187.5% | 0.12 | -25.0% | 0.01 | 0.0% | 0.02 | -40.0% | 0.13 | -3.8% | 0.01 | -43.5% |
| Share % | 3.3% | 3.7% | 0.8% | 1.4% | 4.2% | 1.6% | ||||||
| Syria | 0.05 | 0.0% | 0.11 | +15.8% | 0.00 | 0.0% | 0.05 | +25.0% | 0.06 | +9.1% | 0.05 | 0.0% |
| Share % | 8.2% | 3.4% | 0.0% | 3.6% | 1.9% | 7.9% | ||||||
| Source: USDA, Last Update: 2026-07-11 | ||||||||||||
| Olive Oil - Balance sheet in Mio Tons | Year 2026-27 (Forecast Giugno) | ||||||||||||
|---|---|---|---|---|---|---|---|---|---|---|---|---|
| Country | Beginning Stocks | Production | Import | Export | Consumption | Ending Stocks | ||||||
| World | 0.60 | +21.0% | 3.25 | -0.9% | 1.28 | +0.5% | 1.39 | -0.4% | 3.11 | +2.3% | 0.63 | +3.1% |
| EU-27 | 0.33 | +28.3% | 2.10 | +0.4% | 0.23 | -10.0% | 0.85 | +6.2% | 1.47 | 0.0% | 0.33 | +1.5% |
| Share % | 55.0% | 64.6% | 18.0% | 61.2% | 47.3% | 52.4% | ||||||
| Turkey | 0.04 | -33.3% | 0.40 | +90.5% | 0.03 | 0.0% | 0.15 | +150.0% | 0.22 | +10.0% | 0.10 | +150.0% |
| Share % | 6.7% | 12.3% | 2.3% | 10.8% | 7.1% | 15.9% | ||||||
| Tunisia | 0.05 | +125.0% | 0.25 | -46.8% | 0.00 | 0.0% | 0.24 | -40.0% | 0.04 | -12.5% | 0.03 | -46.3% |
| Share % | 8.3% | 7.7% | 0.0% | 17.3% | 1.3% | 4.8% | ||||||
| Morocco | 0.02 | +187.5% | 0.12 | -25.0% | 0.01 | 0.0% | 0.02 | -40.0% | 0.13 | -3.8% | 0.01 | -43.5% |
| Share % | 3.3% | 3.7% | 0.8% | 1.4% | 4.2% | 1.6% | ||||||
| Syria | 0.05 | 0.0% | 0.11 | +15.8% | 0.00 | 0.0% | 0.05 | +25.0% | 0.06 | +9.1% | 0.05 | 0.0% |
| Share % | 8.3% | 3.4% | 0.0% | 3.6% | 1.9% | 7.9% | ||||||
| Source: USDA, Last Update: 2026-07-11 | ||||||||||||
| Olive Oil - Balance sheet in Mio Tons | Year 2025-26 | ||||||||||||
|---|---|---|---|---|---|---|---|---|---|---|---|---|
| Country | Beginning Stocks | Production | Import | Export | Consumption | Ending Stocks | ||||||
| World | 0.50 | +18.5% | 3.28 | -1.7% | 1.27 | +2.7% | 1.40 | +3.3% | 3.04 | -3.1% | 0.61 | +21.6% |
| EU-27 | 0.25 | +39.6% | 2.09 | -0.9% | 0.25 | +23.8% | 0.80 | -5.5% | 1.47 | +5.4% | 0.33 | +28.3% |
| Share % | 50.0% | 63.7% | 19.7% | 57.1% | 48.4% | 54.1% | ||||||
| Turkey | 0.06 | -39.4% | 0.21 | -48.8% | 0.03 | 0.0% | 0.06 | -24.1% | 0.20 | -50.0% | 0.04 | -33.3% |
| Share % | 12.0% | 6.4% | 2.4% | 4.3% | 6.6% | 6.6% | ||||||
| Tunisia | 0.02 | +140.0% | 0.47 | +38.2% | 0.00 | 0.0% | 0.40 | +37.5% | 0.04 | +14.3% | 0.05 | +125.0% |
| Share % | 4.0% | 14.3% | 0.0% | 28.6% | 1.3% | 8.2% | ||||||
| Morocco | 0.01 | -27.3% | 0.16 | +77.8% | 0.01 | -63.0% | 0.03 | +66.7% | 0.13 | +23.8% | 0.02 | +187.5% |
| Share % | 2.0% | 4.9% | 0.8% | 2.1% | 4.3% | 3.3% | ||||||
| Syria | 0.05 | +6.8% | 0.10 | -9.5% | 0.00 | 0.0% | 0.04 | -4.8% | 0.06 | -8.3% | 0.05 | 0.0% |
| Share % | 10.0% | 3.0% | 0.0% | 2.9% | 2.0% | 8.2% | ||||||
| Source: USDA, Last Update: 2026-07-11 | ||||||||||||
| Palm Oil - Balance sheet in Mio Tons | Year 2026-27 (Forecast July) | ||||||||||||
|---|---|---|---|---|---|---|---|---|---|---|---|---|
| Country | Beginning Stocks | Production | Import | Export | Consumption | Ending Stocks | ||||||
| World | 15.55 | +3.3% | 81.44 | 0.0% | 43.38 | +0.3% | 45.66 | -0.2% | 79.67 | +1.5% | 15.05 | -3.2% |
| Indonesia | 4.49 | +1.7% | 47.50 | +1.7% | 0.00 | 0.0% | 24.15 | +1.9% | 23.38 | +2.0% | 4.47 | -0.6% |
| Share % | 28.9% | 58.3% | 0.0% | 52.9% | 29.3% | 29.7% | ||||||
| Malaysia | 2.48 | +4.9% | 19.60 | -3.0% | 0.45 | -10.0% | 15.80 | -3.4% | 4.27 | +0.8% | 2.46 | -0.8% |
| Share % | 15.9% | 24.1% | 1.0% | 34.6% | 5.4% | 16.3% | ||||||
| Thailand | 0.58 | +40.8% | 3.72 | -4.6% | 0.00 | -50.0% | 1.00 | 0.0% | 2.89 | +5.5% | 0.41 | -28.5% |
| Share % | 3.7% | 4.6% | 0.0% | 2.2% | 3.6% | 2.7% | ||||||
| Colombia | 0.75 | +4.9% | 2.00 | 0.0% | 0.13 | 0.0% | 0.45 | -5.3% | 1.67 | +3.4% | 0.76 | +0.7% |
| Share % | 4.8% | 2.5% | 0.3% | 1.0% | 2.1% | 5.0% | ||||||
| Nigeria | 0.11 | -7.1% | 1.50 | 0.0% | 0.50 | +11.1% | 0.02 | 0.0% | 2.02 | +3.9% | 0.07 | -31.4% |
| Share % | 0.7% | 1.8% | 1.2% | 0.0% | 2.5% | 0.5% | ||||||
| Source: USDA, Last Update: 2026-07-11 | ||||||||||||
| Palm Oil - Balance sheet in Mio Tons | Year 2026-27 (Forecast Giugno) | ||||||||||||
|---|---|---|---|---|---|---|---|---|---|---|---|---|
| Country | Beginning Stocks | Production | Import | Export | Consumption | Ending Stocks | ||||||
| World | 15.42 | +2.4% | 81.36 | -0.1% | 43.38 | +0.3% | 45.66 | -0.2% | 79.57 | +1.4% | 14.93 | -4.0% |
| Indonesia | 4.49 | +1.7% | 47.50 | +1.7% | 0.00 | 0.0% | 24.15 | +1.9% | 23.38 | +2.0% | 4.47 | -0.6% |
| Share % | 29.1% | 58.4% | 0.0% | 52.9% | 29.4% | 29.9% | ||||||
| Malaysia | 2.48 | +4.9% | 19.60 | -3.0% | 0.45 | -10.0% | 15.80 | -3.4% | 4.27 | +0.8% | 2.46 | -0.8% |
| Share % | 16.1% | 24.1% | 1.0% | 34.6% | 5.4% | 16.5% | ||||||
| Thailand | 0.58 | +40.8% | 3.72 | -4.6% | 0.00 | -50.0% | 1.00 | 0.0% | 2.89 | +5.5% | 0.41 | -28.5% |
| Share % | 3.8% | 4.6% | 0.0% | 2.2% | 3.6% | 2.7% | ||||||
| Colombia | 0.75 | +4.9% | 2.00 | 0.0% | 0.13 | 0.0% | 0.45 | -5.3% | 1.67 | +3.4% | 0.76 | +0.7% |
| Share % | 4.9% | 2.5% | 0.3% | 1.0% | 2.1% | 5.1% | ||||||
| Nigeria | 0.11 | -7.1% | 1.50 | 0.0% | 0.50 | +11.1% | 0.02 | 0.0% | 2.02 | +3.9% | 0.07 | -31.4% |
| Share % | 0.7% | 1.8% | 1.2% | 0.0% | 2.5% | 0.5% | ||||||
| Source: USDA, Last Update: 2026-07-11 | ||||||||||||
| Palm Oil - Balance sheet in Mio Tons | Year 2025-26 | ||||||||||||
|---|---|---|---|---|---|---|---|---|---|---|---|---|
| Country | Beginning Stocks | Production | Import | Export | Consumption | Ending Stocks | ||||||
| World | 15.05 | -6.0% | 81.46 | +3.2% | 43.26 | +4.6% | 45.75 | +1.6% | 78.47 | +2.9% | 15.55 | +3.3% |
| Indonesia | 4.42 | -7.2% | 46.70 | +2.6% | 0.00 | -100.0% | 23.70 | +1.0% | 22.93 | +2.5% | 4.49 | +1.7% |
| Share % | 29.4% | 57.3% | 0.0% | 51.8% | 29.2% | 28.9% | ||||||
| Malaysia | 2.36 | +17.2% | 20.20 | +4.2% | 0.50 | -33.2% | 16.35 | +4.7% | 4.24 | +1.7% | 2.48 | +4.9% |
| Share % | 15.7% | 24.8% | 1.2% | 35.7% | 5.4% | 15.9% | ||||||
| Thailand | 0.41 | -0.7% | 3.90 | +4.3% | 0.00 | -50.0% | 1.00 | -23.2% | 2.74 | +11.9% | 0.58 | +40.8% |
| Share % | 2.7% | 4.8% | 0.0% | 2.2% | 3.5% | 3.7% | ||||||
| Colombia | 0.72 | -14.8% | 2.00 | +5.3% | 0.13 | -3.1% | 0.48 | -23.9% | 1.62 | +5.6% | 0.75 | +4.9% |
| Share % | 4.8% | 2.5% | 0.3% | 1.0% | 2.1% | 4.8% | ||||||
| Nigeria | 0.11 | +29.9% | 1.50 | 0.0% | 0.45 | -7.0% | 0.02 | 0.0% | 1.94 | 0.0% | 0.11 | -7.1% |
| Share % | 0.7% | 1.8% | 1.0% | 0.0% | 2.5% | 0.7% | ||||||
| Source: USDA, Last Update: 2026-07-11 | ||||||||||||
| Palm Kernel Oil - Balance sheet in Mio Tons | Year 2026-27 (Forecast July) | ||||||||||||
|---|---|---|---|---|---|---|---|---|---|---|---|---|
| Country | Beginning Stocks | Production | Import | Export | Consumption | Ending Stocks | ||||||
| World | 1.05 | +7.7% | 9.41 | +1.4% | 2.73 | +1.7% | 3.33 | +4.0% | 8.86 | +2.0% | 1.00 | -4.2% |
| Indonesia | 0.48 | +16.4% | 5.45 | +1.7% | 0.00 | 0.0% | 1.65 | +6.5% | 3.81 | +1.9% | 0.47 | -2.1% |
| Share % | 45.7% | 57.9% | 0.0% | 49.5% | 43.0% | 47.0% | ||||||
| Malaysia | 0.25 | 0.0% | 2.24 | +0.4% | 0.15 | +3.4% | 1.13 | +2.3% | 1.29 | +1.2% | 0.22 | -10.2% |
| Share % | 23.8% | 23.8% | 5.5% | 33.9% | 14.6% | 22.0% | ||||||
| Nigeria | 0.02 | -15.0% | 0.46 | -0.7% | 0.00 | 0.0% | 0.01 | -44.4% | 0.46 | +2.2% | 0.01 | -47.1% |
| Share % | 1.9% | 4.9% | 0.0% | 0.3% | 5.2% | 1.0% | ||||||
| Thailand | 0.05 | +7.1% | 0.42 | +4.5% | 0.01 | 0.0% | 0.17 | +3.1% | 0.25 | +4.2% | 0.05 | +13.3% |
| Share % | 4.8% | 4.5% | 0.4% | 5.1% | 2.8% | 5.0% | ||||||
| Colombia | 0.01 | -13.3% | 0.13 | -1.5% | 0.01 | +66.7% | 0.09 | 0.0% | 0.06 | +1.8% | 0.01 | -7.7% |
| Share % | 1.0% | 1.4% | 0.4% | 2.7% | 0.7% | 1.0% | ||||||
| Source: USDA, Last Update: 2026-07-11 | ||||||||||||
| Palm Kernel Oil - Balance sheet in Mio Tons | Year 2026-27 (Forecast Giugno) | ||||||||||||
|---|---|---|---|---|---|---|---|---|---|---|---|---|
| Country | Beginning Stocks | Production | Import | Export | Consumption | Ending Stocks | ||||||
| World | 1.05 | +7.7% | 9.41 | +1.4% | 2.73 | +1.7% | 3.33 | +4.0% | 8.86 | +2.0% | 1.00 | -4.2% |
| Indonesia | 0.48 | +16.4% | 5.45 | +1.7% | 0.00 | 0.0% | 1.65 | +6.5% | 3.81 | +1.9% | 0.47 | -2.1% |
| Share % | 45.7% | 57.9% | 0.0% | 49.5% | 43.0% | 47.0% | ||||||
| Malaysia | 0.25 | 0.0% | 2.24 | +0.4% | 0.15 | +3.4% | 1.13 | +2.3% | 1.29 | +1.2% | 0.22 | -10.2% |
| Share % | 23.8% | 23.8% | 5.5% | 33.9% | 14.6% | 22.0% | ||||||
| Nigeria | 0.02 | -15.0% | 0.46 | -0.7% | 0.00 | 0.0% | 0.01 | -44.4% | 0.46 | +2.2% | 0.01 | -47.1% |
| Share % | 1.9% | 4.9% | 0.0% | 0.3% | 5.2% | 1.0% | ||||||
| Thailand | 0.05 | +7.1% | 0.42 | +4.5% | 0.01 | 0.0% | 0.17 | +3.1% | 0.25 | +4.2% | 0.05 | +13.3% |
| Share % | 4.8% | 4.5% | 0.4% | 5.1% | 2.8% | 5.0% | ||||||
| Colombia | 0.01 | -13.3% | 0.13 | -1.5% | 0.01 | +66.7% | 0.09 | 0.0% | 0.06 | +1.8% | 0.01 | -7.7% |
| Share % | 1.0% | 1.4% | 0.4% | 2.7% | 0.7% | 1.0% | ||||||
| Source: USDA, Last Update: 2026-07-11 | ||||||||||||
| Palm Kernel Oil - Balance sheet in Mio Tons | Year 2025-26 | ||||||||||||
|---|---|---|---|---|---|---|---|---|---|---|---|---|
| Country | Beginning Stocks | Production | Import | Export | Consumption | Ending Stocks | ||||||
| World | 0.97 | +1.2% | 9.28 | +3.9% | 2.69 | -0.5% | 3.20 | +1.0% | 8.69 | +2.8% | 1.05 | +7.7% |
| Indonesia | 0.41 | +43.5% | 5.36 | +3.2% | 0.00 | 0.0% | 1.55 | +7.0% | 3.74 | +3.3% | 0.48 | +16.4% |
| Share % | 42.3% | 57.8% | 0.0% | 48.4% | 43.0% | 45.7% | ||||||
| Malaysia | 0.25 | -32.1% | 2.23 | +5.4% | 0.15 | +2.1% | 1.10 | -4.3% | 1.28 | +4.1% | 0.25 | 0.0% |
| Share % | 25.8% | 24.0% | 5.6% | 34.4% | 14.7% | 23.8% | ||||||
| Nigeria | 0.02 | -28.6% | 0.46 | 0.0% | 0.00 | 0.0% | 0.02 | 0.0% | 0.45 | -1.1% | 0.02 | -15.0% |
| Share % | 2.1% | 5.0% | 0.0% | 0.6% | 5.2% | 1.9% | ||||||
| Thailand | 0.04 | -16.0% | 0.40 | +9.3% | 0.01 | -28.6% | 0.16 | -8.0% | 0.24 | +17.1% | 0.05 | +7.1% |
| Share % | 4.1% | 4.3% | 0.4% | 5.0% | 2.8% | 4.8% | ||||||
| Colombia | 0.02 | +25.0% | 0.14 | +1.5% | 0.01 | -50.0% | 0.09 | -1.1% | 0.06 | +3.8% | 0.01 | -13.3% |
| Share % | 2.1% | 1.5% | 0.4% | 2.8% | 0.7% | 1.0% | ||||||
| Source: USDA, Last Update: 2026-07-11 | ||||||||||||
| Peanut Oil - Balance sheet in Mio Tons | Year 2026-27 (Forecast July) | ||||||||||||
|---|---|---|---|---|---|---|---|---|---|---|---|---|
| Country | Beginning Stocks | Production | Import | Export | Consumption | Ending Stocks | ||||||
| World | 0.40 | +7.8% | 6.34 | +0.5% | 0.37 | +0.5% | 0.44 | 0.0% | 6.26 | +0.9% | 0.41 | +1.7% |
| China | 0.00 | 0.0% | 3.14 | +1.0% | 0.25 | 0.0% | 0.01 | 0.0% | 3.38 | +1.0% | 0.00 | 0.0% |
| Share % | 0.0% | 49.5% | 67.6% | 2.3% | 54.0% | 0.0% | ||||||
| India | 0.24 | +21.5% | 1.32 | 0.0% | 0.00 | 0.0% | 0.10 | 0.0% | 1.21 | +2.5% | 0.26 | +5.3% |
| Share % | 60.0% | 20.8% | 0.0% | 22.7% | 19.3% | 63.4% | ||||||
| Nigeria | 0.00 | 0.0% | 0.27 | 0.0% | 0.00 | 0.0% | 0.00 | 0.0% | 0.26 | 0.0% | 0.00 | 0.0% |
| Share % | 0.0% | 4.3% | 0.0% | 0.0% | 4.2% | 0.0% | ||||||
| Myanmar (Burma) | 0.01 | -25.0% | 0.26 | -4.0% | 0.00 | 0.0% | 0.00 | 0.0% | 0.26 | -5.8% | 0.01 | +50.0% |
| Share % | 2.5% | 4.1% | 0.0% | 0.0% | 4.2% | 2.4% | ||||||
| Brazil | 0.06 | +5.8% | 0.20 | 0.0% | 0.00 | 0.0% | 0.18 | 0.0% | 0.02 | +33.3% | 0.05 | -3.6% |
| Share % | 15.0% | 3.2% | 0.0% | 40.9% | 0.3% | 12.2% | ||||||
| Source: USDA, Last Update: 2026-07-11 | ||||||||||||
| Peanut Oil - Balance sheet in Mio Tons | Year 2026-27 (Forecast Giugno) | ||||||||||||
|---|---|---|---|---|---|---|---|---|---|---|---|---|
| Country | Beginning Stocks | Production | Import | Export | Consumption | Ending Stocks | ||||||
| World | 0.40 | +7.8% | 6.34 | +0.5% | 0.37 | +0.5% | 0.44 | 0.0% | 6.26 | +0.9% | 0.41 | +1.7% |
| China | 0.00 | 0.0% | 3.14 | +1.0% | 0.25 | 0.0% | 0.01 | 0.0% | 3.38 | +1.0% | 0.00 | 0.0% |
| Share % | 0.0% | 49.5% | 67.6% | 2.3% | 54.0% | 0.0% | ||||||
| India | 0.24 | +21.5% | 1.32 | 0.0% | 0.00 | 0.0% | 0.10 | 0.0% | 1.21 | +2.5% | 0.26 | +5.3% |
| Share % | 60.0% | 20.8% | 0.0% | 22.7% | 19.3% | 63.4% | ||||||
| Nigeria | 0.00 | 0.0% | 0.27 | 0.0% | 0.00 | 0.0% | 0.00 | 0.0% | 0.26 | 0.0% | 0.00 | 0.0% |
| Share % | 0.0% | 4.3% | 0.0% | 0.0% | 4.2% | 0.0% | ||||||
| Myanmar (Burma) | 0.01 | -25.0% | 0.26 | -4.0% | 0.00 | 0.0% | 0.00 | 0.0% | 0.26 | -5.8% | 0.01 | +50.0% |
| Share % | 2.5% | 4.1% | 0.0% | 0.0% | 4.2% | 2.4% | ||||||
| Brazil | 0.06 | +5.8% | 0.20 | 0.0% | 0.00 | 0.0% | 0.18 | 0.0% | 0.02 | +33.3% | 0.05 | -3.6% |
| Share % | 15.0% | 3.2% | 0.0% | 40.9% | 0.3% | 12.2% | ||||||
| Source: USDA, Last Update: 2026-07-11 | ||||||||||||
| Peanut Oil - Balance sheet in Mio Tons | Year 2025-26 | ||||||||||||
|---|---|---|---|---|---|---|---|---|---|---|---|---|
| Country | Beginning Stocks | Production | Import | Export | Consumption | Ending Stocks | ||||||
| World | 0.37 | +12.8% | 6.31 | 0.0% | 0.37 | -22.6% | 0.44 | -25.8% | 6.21 | +0.9% | 0.40 | +7.8% |
| China | 0.00 | 0.0% | 3.10 | 0.0% | 0.25 | -28.0% | 0.01 | -9.1% | 3.34 | -2.8% | 0.00 | 0.0% |
| Share % | 0.0% | 49.1% | 67.6% | 2.3% | 53.8% | 0.0% | ||||||
| India | 0.20 | +7.0% | 1.32 | +5.3% | 0.00 | 0.0% | 0.10 | -57.1% | 1.18 | +16.8% | 0.24 | +21.5% |
| Share % | 54.1% | 20.9% | 0.0% | 22.7% | 19.0% | 60.0% | ||||||
| Nigeria | 0.00 | 0.0% | 0.27 | 0.0% | 0.00 | 0.0% | 0.00 | 0.0% | 0.26 | 0.0% | 0.00 | 0.0% |
| Share % | 0.0% | 4.3% | 0.0% | 0.0% | 4.2% | 0.0% | ||||||
| Myanmar (Burma) | 0.01 | +33.3% | 0.27 | +2.2% | 0.00 | 0.0% | 0.00 | 0.0% | 0.28 | +3.8% | 0.01 | -25.0% |
| Share % | 2.7% | 4.3% | 0.0% | 0.0% | 4.5% | 2.5% | ||||||
| Brazil | 0.05 | +23.8% | 0.20 | 0.0% | 0.00 | 0.0% | 0.18 | +4.0% | 0.02 | 0.0% | 0.06 | +5.8% |
| Share % | 13.5% | 3.2% | 0.0% | 40.9% | 0.3% | 15.0% | ||||||
| Source: USDA, Last Update: 2026-07-11 | ||||||||||||
| Rapeseed Oil - Balance sheet in Mio Tons | Year 2026-27 (Forecast July) | ||||||||||||
|---|---|---|---|---|---|---|---|---|---|---|---|---|
| Country | Beginning Stocks | Production | Import | Export | Consumption | Ending Stocks | ||||||
| World | 3.50 | +6.2% | 37.43 | +3.2% | 8.37 | +7.3% | 8.71 | +9.0% | 37.24 | +3.8% | 3.36 | -4.0% |
| EU-27 | 0.49 | +79.9% | 10.54 | -1.2% | 0.40 | -38.5% | 0.60 | 0.0% | 10.50 | 0.0% | 0.33 | -32.2% |
| Share % | 14.0% | 28.2% | 4.8% | 6.9% | 28.2% | 9.8% | ||||||
| China | 1.03 | -17.9% | 7.80 | +3.1% | 2.25 | +4.7% | 0.04 | -55.6% | 10.00 | +1.5% | 1.04 | +1.0% |
| Share % | 29.4% | 20.8% | 26.9% | 0.5% | 26.9% | 31.0% | ||||||
| Canada | 0.79 | +8.2% | 5.61 | +5.9% | 0.02 | 0.0% | 4.00 | +12.7% | 1.73 | +0.9% | 0.70 | -11.6% |
| Share % | 22.6% | 15.0% | 0.2% | 45.9% | 4.6% | 20.8% | ||||||
| India | 0.40 | +11.2% | 4.26 | +4.2% | 0.04 | 0.0% | 0.01 | 0.0% | 4.28 | +4.9% | 0.41 | +2.8% |
| Share % | 11.4% | 11.4% | 0.5% | 0.1% | 11.5% | 12.2% | ||||||
| Russia | 0.14 | +23.1% | 1.83 | +9.3% | 0.15 | 0.0% | 1.75 | +9.4% | 0.21 | +5.0% | 0.17 | +16.0% |
| Share % | 4.0% | 4.9% | 1.8% | 20.1% | 0.6% | 5.1% | ||||||
| Source: USDA, Last Update: 2026-07-11 | ||||||||||||
| Rapeseed Oil - Balance sheet in Mio Tons | Year 2026-27 (Forecast Giugno) | ||||||||||||
|---|---|---|---|---|---|---|---|---|---|---|---|---|
| Country | Beginning Stocks | Production | Import | Export | Consumption | Ending Stocks | ||||||
| World | 3.31 | +0.3% | 37.28 | +2.8% | 8.37 | +7.3% | 8.71 | +9.0% | 37.03 | +3.2% | 3.23 | -7.6% |
| EU-27 | 0.35 | +27.1% | 10.54 | -1.2% | 0.40 | -38.5% | 0.60 | 0.0% | 10.35 | -1.4% | 0.34 | -31.0% |
| Share % | 10.6% | 28.3% | 4.8% | 6.9% | 28.0% | 10.5% | ||||||
| China | 1.03 | -17.7% | 7.80 | +3.1% | 2.25 | +4.7% | 0.04 | -55.6% | 10.00 | +1.5% | 1.04 | +1.3% |
| Share % | 31.1% | 20.9% | 26.9% | 0.5% | 27.0% | 32.2% | ||||||
| Canada | 0.75 | +2.1% | 5.53 | +4.3% | 0.02 | 0.0% | 4.00 | +12.7% | 1.73 | +0.9% | 0.57 | -28.1% |
| Share % | 22.7% | 14.8% | 0.2% | 45.9% | 4.7% | 17.6% | ||||||
| India | 0.40 | +11.2% | 4.26 | +4.2% | 0.04 | 0.0% | 0.01 | 0.0% | 4.28 | +4.9% | 0.41 | +2.8% |
| Share % | 12.1% | 11.4% | 0.5% | 0.1% | 11.6% | 12.7% | ||||||
| Russia | 0.14 | +23.1% | 1.83 | +9.3% | 0.15 | 0.0% | 1.75 | +9.4% | 0.21 | +5.0% | 0.17 | +16.0% |
| Share % | 4.2% | 4.9% | 1.8% | 20.1% | 0.6% | 5.3% | ||||||
| Source: USDA, Last Update: 2026-07-11 | ||||||||||||
| Rapeseed Oil - Balance sheet in Mio Tons | Year 2025-26 | ||||||||||||
|---|---|---|---|---|---|---|---|---|---|---|---|---|
| Country | Beginning Stocks | Production | Import | Export | Consumption | Ending Stocks | ||||||
| World | 3.30 | -4.7% | 36.27 | +5.8% | 7.80 | +10.2% | 7.99 | +11.8% | 35.88 | +4.4% | 3.50 | +6.2% |
| EU-27 | 0.27 | -11.7% | 10.67 | +7.2% | 0.65 | +120.3% | 0.60 | +2.6% | 10.50 | +8.2% | 0.49 | +79.9% |
| Share % | 8.2% | 29.4% | 8.3% | 7.5% | 29.3% | 14.0% | ||||||
| China | 1.25 | -22.3% | 7.57 | -3.5% | 2.15 | -1.0% | 0.09 | +373.7% | 9.85 | -4.8% | 1.03 | -17.9% |
| Share % | 37.9% | 20.9% | 27.6% | 1.1% | 27.5% | 29.4% | ||||||
| Canada | 0.73 | +32.7% | 5.30 | +9.9% | 0.02 | +25.0% | 3.55 | +6.7% | 1.71 | +28.6% | 0.79 | +8.2% |
| Share % | 22.1% | 14.6% | 0.3% | 44.4% | 4.8% | 22.6% | ||||||
| India | 0.36 | -9.2% | 4.09 | +3.4% | 0.04 | +53.8% | 0.01 | -23.1% | 4.08 | +1.9% | 0.40 | +11.2% |
| Share % | 10.9% | 11.3% | 0.5% | 0.1% | 11.4% | 11.4% | ||||||
| Russia | 0.12 | +58.1% | 1.68 | +16.2% | 0.15 | 0.0% | 1.60 | +18.5% | 0.20 | 0.0% | 0.14 | +23.1% |
| Share % | 3.6% | 4.6% | 1.9% | 20.0% | 0.6% | 4.0% | ||||||
| Source: USDA, Last Update: 2026-07-11 | ||||||||||||
| Soybean Oil - Balance sheet in Mio Tons | Year 2026-27 (Forecast July) | ||||||||||||
|---|---|---|---|---|---|---|---|---|---|---|---|---|
| Country | Beginning Stocks | Production | Import | Export | Consumption | Ending Stocks | ||||||
| World | 6.32 | -2.3% | 74.90 | +3.5% | 13.39 | +1.9% | 14.69 | +1.4% | 73.12 | +2.7% | 6.80 | +7.7% |
| China | 0.81 | +9.1% | 21.56 | +1.8% | 0.30 | 0.0% | 0.90 | 0.0% | 20.80 | +1.5% | 0.97 | +19.2% |
| Share % | 12.8% | 28.8% | 2.2% | 6.1% | 28.4% | 14.3% | ||||||
| United States | 0.83 | +5.2% | 14.78 | +5.6% | 0.27 | +81.3% | 0.18 | -60.1% | 14.86 | +8.8% | 0.85 | +2.2% |
| Share % | 13.1% | 19.7% | 2.0% | 1.2% | 20.3% | 12.5% | ||||||
| Brazil | 0.20 | -4.8% | 13.26 | +5.7% | 0.10 | 0.0% | 1.70 | +6.2% | 11.40 | +3.2% | 0.46 | +132.0% |
| Share % | 3.2% | 17.7% | 0.7% | 11.6% | 15.6% | 6.8% | ||||||
| Argentina | 0.39 | +21.4% | 8.58 | +2.4% | 0.12 | 0.0% | 6.65 | +3.1% | 1.99 | +0.5% | 0.45 | +15.1% |
| Share % | 6.2% | 11.5% | 0.9% | 45.3% | 2.7% | 6.6% | ||||||
| EU-27 | 0.54 | -14.8% | 2.76 | -2.0% | 0.60 | -7.7% | 0.80 | -5.9% | 2.56 | -5.5% | 0.54 | 0.0% |
| Share % | 8.5% | 3.7% | 4.5% | 5.4% | 3.5% | 7.9% | ||||||
| Source: USDA, Last Update: 2026-07-11 | ||||||||||||
| Soybean Oil - Balance sheet in Mio Tons | Year 2026-27 (Forecast Giugno) | ||||||||||||
|---|---|---|---|---|---|---|---|---|---|---|---|---|
| Country | Beginning Stocks | Production | Import | Export | Consumption | Ending Stocks | ||||||
| World | 6.04 | -6.6% | 74.69 | +3.2% | 13.19 | +0.3% | 14.49 | +0.0% | 73.00 | +2.6% | 6.43 | +1.8% |
| China | 0.82 | +9.9% | 21.36 | +0.9% | 0.30 | 0.0% | 0.70 | -22.2% | 20.80 | +1.5% | 0.98 | +20.6% |
| Share % | 13.6% | 28.6% | 2.3% | 4.8% | 28.5% | 15.2% | ||||||
| United States | 0.83 | +5.2% | 14.78 | +5.6% | 0.27 | +81.3% | 0.18 | -60.1% | 14.86 | +8.8% | 0.85 | +2.2% |
| Share % | 13.7% | 19.8% | 2.0% | 1.2% | 20.4% | 13.2% | ||||||
| Brazil | 0.20 | -4.8% | 13.26 | +5.7% | 0.10 | 0.0% | 1.70 | +6.2% | 11.40 | +3.2% | 0.46 | +132.0% |
| Share % | 3.3% | 17.8% | 0.8% | 11.7% | 15.6% | 7.2% | ||||||
| Argentina | 0.39 | +21.4% | 8.58 | +2.4% | 0.12 | 0.0% | 6.65 | +3.1% | 1.99 | +0.5% | 0.45 | +15.1% |
| Share % | 6.5% | 11.5% | 0.9% | 45.9% | 2.7% | 7.0% | ||||||
| EU-27 | 0.54 | -14.8% | 2.76 | -2.0% | 0.60 | -7.7% | 0.80 | -5.9% | 2.56 | -5.5% | 0.54 | 0.0% |
| Share % | 8.9% | 3.7% | 4.5% | 5.5% | 3.5% | 8.4% | ||||||
| Source: USDA, Last Update: 2026-07-11 | ||||||||||||
| Soybean Oil - Balance sheet in Mio Tons | Year 2025-26 | ||||||||||||
|---|---|---|---|---|---|---|---|---|---|---|---|---|
| Country | Beginning Stocks | Production | Import | Export | Consumption | Ending Stocks | ||||||
| World | 6.47 | +13.8% | 72.36 | +3.3% | 13.15 | -8.0% | 14.49 | -5.0% | 71.17 | +4.2% | 6.32 | -2.3% |
| China | 0.75 | -36.1% | 21.17 | +5.3% | 0.30 | +1.4% | 0.90 | +183.0% | 20.50 | 0.0% | 0.81 | +9.1% |
| Share % | 11.6% | 29.3% | 2.3% | 6.2% | 28.8% | 12.8% | ||||||
| United States | 0.79 | +12.7% | 14.00 | +5.6% | 0.15 | -8.5% | 0.45 | -59.5% | 13.65 | +11.8% | 0.83 | +5.2% |
| Share % | 12.2% | 19.3% | 1.1% | 3.1% | 19.2% | 13.1% | ||||||
| Brazil | 0.21 | +16.9% | 12.54 | +5.9% | 0.10 | +17.6% | 1.60 | +7.6% | 11.05 | +6.1% | 0.20 | -4.8% |
| Share % | 3.2% | 17.3% | 0.8% | 11.0% | 15.5% | 3.2% | ||||||
| Argentina | 0.32 | -51.7% | 8.38 | -2.9% | 0.12 | +12.1% | 6.45 | -9.1% | 1.98 | 0.0% | 0.39 | +21.4% |
| Share % | 4.9% | 11.6% | 0.9% | 44.5% | 2.8% | 6.2% | ||||||
| EU-27 | 0.63 | -4.6% | 2.81 | -3.9% | 0.65 | -14.1% | 0.85 | +20.1% | 2.71 | -10.0% | 0.54 | -14.8% |
| Share % | 9.7% | 3.9% | 4.9% | 5.9% | 3.8% | 8.5% | ||||||
| Source: USDA, Last Update: 2026-07-11 | ||||||||||||
| Sunflowerseed Oil - Balance sheet in Mio Tons | Year 2026-27 (Forecast July) | ||||||||||||
|---|---|---|---|---|---|---|---|---|---|---|---|---|
| Country | Beginning Stocks | Production | Import | Export | Consumption | Ending Stocks | ||||||
| World | 2.42 | -5.1% | 23.59 | +11.7% | 14.24 | +21.3% | 15.62 | +14.2% | 21.70 | +12.3% | 2.93 | +21.3% |
| Russia | 0.32 | +63.1% | 7.72 | +12.0% | 0.00 | 0.0% | 5.00 | +19.0% | 2.70 | +4.9% | 0.34 | +7.5% |
| Share % | 13.2% | 32.7% | 0.0% | 32.0% | 12.4% | 11.6% | ||||||
| Ukraine | 0.14 | -41.5% | 5.42 | +14.5% | 0.00 | 0.0% | 4.90 | +12.0% | 0.47 | +3.3% | 0.19 | +34.0% |
| Share % | 5.8% | 23.0% | 0.0% | 31.4% | 2.2% | 6.5% | ||||||
| EU-27 | 0.40 | -4.3% | 3.85 | +21.3% | 2.60 | +5.1% | 0.85 | +30.8% | 5.49 | +9.5% | 0.51 | +27.0% |
| Share % | 16.5% | 16.3% | 18.3% | 5.4% | 25.3% | 17.4% | ||||||
| Argentina | 0.15 | +29.3% | 2.67 | +6.1% | 0.00 | 0.0% | 2.05 | +6.5% | 0.57 | +0.9% | 0.21 | +38.0% |
| Share % | 6.2% | 11.3% | 0.0% | 13.1% | 2.6% | 7.2% | ||||||
| Turkey | 0.14 | +26.6% | 1.01 | -3.1% | 1.60 | +23.1% | 1.10 | +22.2% | 1.44 | +1.8% | 0.21 | +52.2% |
| Share % | 5.8% | 4.3% | 11.2% | 7.0% | 6.6% | 7.2% | ||||||
| Source: USDA, Last Update: 2026-07-11 | ||||||||||||
| Sunflowerseed Oil - Balance sheet in Mio Tons | Year 2026-27 (Forecast Giugno) | ||||||||||||
|---|---|---|---|---|---|---|---|---|---|---|---|---|
| Country | Beginning Stocks | Production | Import | Export | Consumption | Ending Stocks | ||||||
| World | 2.43 | -4.6% | 23.51 | +11.3% | 14.24 | +21.3% | 15.62 | +14.2% | 21.66 | +12.1% | 2.90 | +20.1% |
| Russia | 0.32 | +63.1% | 7.52 | +9.0% | 0.00 | 0.0% | 4.85 | +15.5% | 2.68 | +3.9% | 0.31 | -2.2% |
| Share % | 13.2% | 32.0% | 0.0% | 31.0% | 12.4% | 10.7% | ||||||
| Ukraine | 0.14 | -41.5% | 5.63 | +19.1% | 0.00 | 0.0% | 5.10 | +16.6% | 0.47 | +3.3% | 0.20 | +44.7% |
| Share % | 5.8% | 23.9% | 0.0% | 32.7% | 2.2% | 6.9% | ||||||
| EU-27 | 0.40 | -4.3% | 3.80 | +20.0% | 2.60 | +5.1% | 0.85 | +30.8% | 5.44 | +8.5% | 0.52 | +28.8% |
| Share % | 16.5% | 16.2% | 18.3% | 5.4% | 25.1% | 17.9% | ||||||
| Argentina | 0.15 | +29.3% | 2.67 | +6.1% | 0.00 | 0.0% | 2.05 | +6.5% | 0.57 | +0.9% | 0.21 | +38.0% |
| Share % | 6.2% | 11.4% | 0.0% | 13.1% | 2.6% | 7.2% | ||||||
| Turkey | 0.19 | +72.5% | 1.01 | -3.1% | 1.60 | +23.1% | 1.10 | +22.2% | 1.49 | +5.3% | 0.21 | +52.2% |
| Share % | 7.8% | 4.3% | 11.2% | 7.0% | 6.9% | 7.2% | ||||||
| Source: USDA, Last Update: 2026-07-11 | ||||||||||||
| Sunflowerseed Oil - Balance sheet in Mio Tons | Year 2025-26 | ||||||||||||
|---|---|---|---|---|---|---|---|---|---|---|---|---|
| Country | Beginning Stocks | Production | Import | Export | Consumption | Ending Stocks | ||||||
| World | 2.55 | -12.0% | 21.12 | +3.5% | 11.74 | -2.2% | 13.67 | +0.1% | 19.32 | +1.2% | 2.42 | -5.1% |
| Russia | 0.20 | -17.7% | 6.90 | +2.5% | 0.00 | 0.0% | 4.20 | 0.0% | 2.58 | 0.0% | 0.32 | +63.1% |
| Share % | 7.8% | 32.7% | 0.0% | 30.7% | 13.4% | 13.2% | ||||||
| Ukraine | 0.24 | +79.9% | 4.73 | -10.6% | 0.00 | -100.0% | 4.38 | -7.8% | 0.46 | +3.4% | 0.14 | -41.5% |
| Share % | 9.4% | 22.4% | 0.0% | 32.0% | 2.4% | 5.8% | ||||||
| EU-27 | 0.42 | -40.2% | 3.17 | -1.3% | 2.48 | +2.7% | 0.65 | -5.9% | 5.01 | -3.8% | 0.40 | -4.3% |
| Share % | 16.5% | 15.0% | 21.1% | 4.8% | 25.9% | 16.5% | ||||||
| Argentina | 0.12 | -52.5% | 2.52 | +18.9% | 0.00 | 0.0% | 1.93 | +14.2% | 0.56 | 0.0% | 0.15 | +29.3% |
| Share % | 4.7% | 11.9% | 0.0% | 14.1% | 2.9% | 6.2% | ||||||
| Turkey | 0.11 | -35.5% | 1.04 | +31.3% | 1.30 | +5.2% | 0.90 | -10.1% | 1.42 | +29.8% | 0.14 | +26.6% |
| Share % | 4.3% | 4.9% | 11.1% | 6.6% | 7.3% | 5.8% | ||||||
| Source: USDA, Last Update: 2026-07-11 | ||||||||||||
Show the data of:
Previous season
Current season
Show the data of:
Previous season
Current season
Show the data of:
Previous season
Current season
Show the data of:
Previous season
Current season
Show the data of:
Previous season
Current season
| Oranges - Balance sheet in Million Tons | Year 2024-25 (Forecast October) | |||||||||||
|---|---|---|---|---|---|---|---|---|---|---|---|
| Country | Production | Prod. for Processing | Import | Export | Fresh Consumption | ||||||
| World |
Login to consult this balance
The login can be done from the bar at the top of the page, by clicking on "Login" on the right, next to the flags. Don't Have an Account? Click here to sign up. |
||||||||||
| Brazil | |||||||||||
| China | |||||||||||
| EU-27 | |||||||||||
| Mexico | |||||||||||
| Egypt | |||||||||||
| Source: USDA, Last Update: 2025-10-22 | |||||||||||
| Apples - Balance sheet in Million Tons | Year 2024-25 (Forecast October) | |||||||||
|---|---|---|---|---|---|---|---|---|---|
| Country | Production | Import | Export | Consumption | |||||
| World |
Login to consult this balance
The login can be done from the bar at the top of the page, by clicking on "Login" on the right, next to the flags. Don't Have an Account? Click here to sign up. |
||||||||
| China | |||||||||
| EU-27 | |||||||||
| United States | |||||||||
| Turkey | |||||||||
| India | |||||||||
| Source: USDA, Last Update: 2025-10-22 | |||||||||
| Pears - Balance sheet in Million Tons | Year 2024-25 (Forecast October) | |||||||||
|---|---|---|---|---|---|---|---|---|---|
| Country | Production | Import | Export | Consumption | |||||
| World |
Login to consult this balance
The login can be done from the bar at the top of the page, by clicking on "Login" on the right, next to the flags. Don't Have an Account? Click here to sign up. |
||||||||
| China | |||||||||
| EU-27 | |||||||||
| Argentina | |||||||||
| Turkey | |||||||||
| South Africa | |||||||||
| Source: USDA, Last Update: 2025-10-22 | |||||||||
| Lemons - Balance sheet in Million Tons | Year 2024-25 (Forecast October) | |||||||||||
|---|---|---|---|---|---|---|---|---|---|---|---|
| Country | Production | Prod. for Processing | Import | Export | Fresh Consumption | ||||||
| World |
Login to consult this balance
The login can be done from the bar at the top of the page, by clicking on "Login" on the right, next to the flags. Don't Have an Account? Click here to sign up. |
||||||||||
| Mexico | |||||||||||
| Turkey | |||||||||||
| EU-27 | |||||||||||
| Argentina | |||||||||||
| United States | |||||||||||
| Source: USDA, Last Update: 2025-10-22 | |||||||||||
| Peaches and Nectarines - Balance sheet in Million Tons | Year 2025-26 (Forecast October) | |||||||||
|---|---|---|---|---|---|---|---|---|---|
| Country | Production | Import | Export | Consumption | |||||
| World |
Login to consult this balance
The login can be done from the bar at the top of the page, by clicking on "Login" on the right, next to the flags. Don't Have an Account? Click here to sign up. |
||||||||
| China | |||||||||
| EU-27 | |||||||||
| United States | |||||||||
| Turkey | |||||||||
| Iran | |||||||||
| Source: USDA, Last Update: 2025-10-22 | |||||||||
Show the data of:
Annata precedente
Current season
| Sugar - Balance sheet in Mio Tons | Year 2026 (Forecast May) | |||||||||||||||
|---|---|---|---|---|---|---|---|---|---|---|---|---|---|---|---|
| Country | Beginning Stocks | Production (Beet) | Production (Cane) | Import | Export | Human Consumption | Ending Stocks | ||||||||
| World |
Login to consult this balance
The login can be done from the bar at the top of the page, by clicking on "Login" on the right, next to the flags. Don't Have an Account? Click here to sign up. |
||||||||||||||
| Brazil | |||||||||||||||
| India | |||||||||||||||
| EU-27 | |||||||||||||||
| China | |||||||||||||||
| Thailand | |||||||||||||||
| Source: USDA, Last Update: 2026-05-29 | |||||||||||||||
TESEO by CLAL.itenter
TESEO è il nuovo contenitore informatico sviluppato dal team
di CLAL.it.
TESEO analizza il mercato agricolo ed allevatoriale, rende disponibili dati, notizie e sintesi
mediante un'attività di informazione e formazione.
Compare your
performanceenter

Registrati al network CLAL.itregistrati
La registrazione è gratuita e consente di ricevere informazioni ed aggiornamenti via e-mail riguardo a nuove pagine web, novità dal mondo lattiero-caseario ed agricolo italiano e mondiale.
Registrati »
for a continuous update
TESEO is supported by:
Agricultural Market Feed
| IT, Bologna: NON-GMO Hulled Roasted Soybean Meal - Italian price | Increased | 510 | €/ton | +4,08% |
| IT, Bologna: Chopped corn (Standing plants) | Increased | 52 | €/ton | +30,00% |
| IT, Bologna: Wholegrain Sunflower Meal price | Decreased | 254 | €/ton | -1,93% |
| IT, Bologna: GMO Wholegrain Roasted Soybean Meal - Italian price | Increased | 395 | €/ton | +2,60% |
| IT, Bologna: Barley - s.w. 64 and over | Increased | 218 | €/ton | +2,35% |
| IT, Bologna: NON-GMO Wholegrain Roasted Soybean Meal - Italian price | Increased | 468 | €/ton | +4,46% |
| IT, Bologna: Common Wheat - fino price | Increased | 230 | €/ton | +3,60% |
| IT, Bologna: Corn - Italian for livestock (with characteristics) price | Increased | 259 | €/ton | +1,17% |
| IT, Bologna: Common Wheat - buono mercantile price | Increased | 223 | €/ton | +3,72% |
| IT, Bologna: Barley - s.w. 61-63 price | Increased | 211 | €/ton | +2,43% |
| IT, Bologna: Italian Soybeans price | Increased | 475 | €/ton | +3,26% |
| IT, Bologna: Corn - Italian for livestock (contr. 103) price | Increased | 246 | €/ton | +1,23% |
- Market News evidences only the changes; should no price change or no quotation take place, any mention will be made.
- The change/variation concerning PRODUCTION/OUTPUT quantity refers to the same period of the previous year.
- The change/variation concerning STOCK quantity refers to the previous month.
- The change/variation of price refers to PRICES expressed in local currency (for both EU and the World). The change refers to the previous week/month/year, as the case may be. In the case of dual-listed (min and max), changes are calculated using the MAX PRICE.
Fertilizer Prices
| IT, Turin - Triple superphosphate 46% | Stabile | 620 | €/ton |
| IT, Turin - Ammonium nitrate 26% | Stabile | 410 | €/ton |
| IT, Turin - Urea 46% | In aumento | 605 | €/ton |
Feed Cost
| Weight of the Protein Component | 41% |
| Simulated Feed Ration (vs prev month) | +0.50% |
| Milk:Feed Ratio | 1.60 |