































































































































Argentina: dairy sector
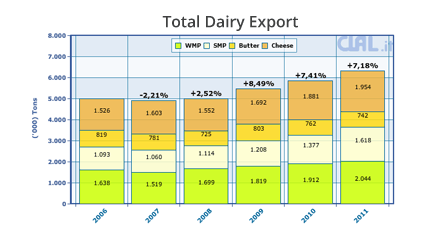
This page contains data regarding key components of the Argentinian dairy industry over a given time period.
The following report:
- highlights the complexity of the industry, which should be considered from several viewpoints: the commodities area, the variety of dairy derivatives, transit trade and domestic consumption;
- indicates how the export-import ratio is completely in favour of exports;
- stresses the particular features of a traditional product that is prevalent in domestic consumption: the dulce de leche.
| ARGENTINA: DAIRY SECTOR | ||||||||||
| x 1.000 ton | ||||||||||
| RAW MATERIAL AREA | 2022 | 2023 | 2024 | 2025 | 2025 | 2026 | % | Period | ||
| Number of dairy cows ('000) (Source: FAO) | 1.563 | 1.546 | 1.545 | |||||||
| Number of dairy cows ('000) (Source: Senasa) | 1.527 | 1.506 | 1.522 | 1.498 | ||||||
| Milk production (Mil Lt) | 11.557 | 11.326 | 10.590 | 11.618 | 8.308 | 8.647 | +4,1% | Jan-Sep 2026 | ||
| Farm gate milk price (€ x 100 lt) | 36,14 | 35,63 | 38,42 | 33,84 | 35,62 | 30,38 | -14,7% | Jan-Sep 2026 | ||
| ± % Over the same period of the previous year | -1,4% | +7,8% | -11,9% | |||||||
| Corn price (Rosario) (€\Ton) | 232,8 | 211,3 | 164,6 | 165,0 | 165,2 | 158,8 (p) | -3,9% | Jan-Nov 2026 | ||
| Soybeans price (Rosario) (€\Ton) | 406,0 | 409,9 | 282,4 | 266,5 | 264,1 | 293,3 (p) | +11,0% | Jan-Nov 2026 | ||
| DAIRY PRODUCTION | 2022 | 2023 | 2024 | 2025 | 2025 | 2026 | % | Period | ||
| Liquid milk (Mil Lt) | 1.168 | 1.168 | 1.092 | 1.077 | 813 | 854 | +5,0% | Jan-Sep 2026 | ||
Butter

|
39 | 35 | 32 | 38 | 27 | 29 | +7,2% | Jan-Sep 2026 | ||
|
Cheese
|
460 | 477 | 461 | 480 | 356 | 371 | +4,0% | Jan-Sep 2026 | ||
|
Hard cheese
|
38 | 45 | 40 | 36 | 28 | 24 | -16,6% | Jan-Sep 2026 | ||
|
Semi-hard cheese
|
156 | 162 | 163 | 165 | 124 | 133 | +7,3% | Jan-Sep 2026 | ||
|
Soft cheese
|
176 | 181 | 187 | 193 | 144 | 151 | +4,6% | Jan-Sep 2026 | ||
|
Processed cheese
|
57 | 60 | 43 | 50 | 38 | 43 | +13,8% | Jan-Sep 2026 | ||
| Other cheeses (grated, powdered, melted, etc.) | 33 | 31 | 27 | 29 | 22 | 20 | -8,5% | Jan-Sep 2026 | ||
|
WMP (Whole milk powder)
|
213 | 185 | 173 | 195 | 126 | 133 | +5,2% | Jan-Sep 2026 | ||
|
SMP (Skimmed milk powder)
|
51 | 33 | 36 | 48 | 35 | 35 | -0,9% | Jan-Sep 2026 | ||
| Cream | 66 | 63 | 61 | 71 | 51 | 51 | +1,8% | Jan-Sep 2026 | ||
| Dulce de leche | 102 | 105 | 97 | 101 | 78 | 82 | +5,0% | Jan-Sep 2026 | ||
| Milk chocolate (Mil Lt) | 46 | 34 | 27 | 33 | 21 | 23 | +6,3% | Jan-Sep 2026 | ||
| Dairy desserts and custards | 27 | 24 | 11 | 13 | 10 | 12 | +15,4% | Jan-Sep 2026 | ||
| Yogurt | 352 | 345 | 310 | 316 | 233 | 242 | +3,9% | Jan-Sep 2026 | ||
| EXPORT | 2022 | 2023 | 2024 | 2025 | 2025 | 2026 | % | Period | ||
| Whey powder (HS 0404) | TOP importers | 38 | 40 | 45 | 46 | 34 | 37 | +10,4% | Jan-Sep 2026 | |
| Butter (HS 0405) | TOP importers | 12 | 5,6 | 4,3 | 4,9 | 2,6 | 5,2 | +95,0% | Jan-Sep 2026 | |
| Cheese (HS 0406) | TOP importers | 57 | 64 | 78 | 74 | 53 | 68 | +27,3% | Jan-Sep 2026 | |
| SMP (skimmed milk powder - HS 040210) | TOP importers | 16 | 17 | 17 | 26 | 18 | 20 | +11,7% | Jan-Sep 2026 | |
| WMP (whole milk powder - HS 040221+040229) | TOP importers | 133 | 96 | 112 | 135 | 82 | 90 | +9,6% | Jan-Sep 2026 | |
| Infant milk formula (HS 190110) | TOP importers | 0,1 | 0,3 | 0,2 | 0,1 | 0,1 | 0,1 | -49,3% | Jan 2026 | |
| Dulce de Leche (HS 19019020) | TOP importers | 2,3 | 2,8 | 3,2 | 3,7 | 2,5 | 4,0 | +59,8% | Jan-Sep 2026 | |
| IMPORT | 2022 | 2023 | 2024 | 2025 | 2025 | 2026 | % | Period | ||
| Condensed milk (HS 040291+040299) | TOP exporters | 0,4 | 0,1 | 0,3 | 0,5 | 0,5 | 0,5 | -0,4% | Jan-Sep 2026 | |
| Whey powder (HS 0404) | TOP exporters | 1,0 | 1,1 | 1,5 | 2,8 | 2,1 | 1,9 | -10,0% | Jan-Sep 2026 | |
| Cheese (HS 0406) | TOP exporters | 4,6 | 2,9 | 1,3 | 2,0 | 1,5 | 1,6 | +6,4% | Jan-Sep 2026 | |
| Infant milk formula (HS 190110) | TOP exporters | 1,8 | 0,8 | 0,2 | 0,2 | 0,2 | 0,1 | -23,5% | Jan-Sep 2026 | |
| STOCK (at 31 December) | 2022 | 2023 | 2024 | 2025 | 2025 | 2026 | % | Period | ||
| Liquid milk (Mil Lt) | 41,0 | 37,1 | 51,9 | 33,6 | 42,7 | 43,5 | +2,0% | Sep 2026 | ||
|
Butter
|
5,2 | 4,1 | 2,6 | 5,3 | 4,4 | 5,4 | +24,4% | Sep 2026 | ||
|
Cheese
|
49,9 | 55,3 | 54,7 | 56,9 | 55,5 | 47,8 | -13,9% | Sep 2026 | ||
|
Hard cheese
|
15,5 | 18,5 | 20,2 | 19,1 | 19,3 | 13,7 | -28,9% | Sep 2026 | ||
|
Semi-hard cheese
|
18,0 | 20,2 | 19,2 | 20,8 | 21,2 | 18,1 | -14,8% | Sep 2026 | ||
|
Soft cheese
|
12,7 | 12,5 | 12,0 | 12,4 | 11,0 | 11,2 | +2,4% | Sep 2026 | ||
|
Processed cheese
|
1,5 | 2,1 | 1,5 | 1,1 | 1,5 | 1,9 | +31,8% | Sep 2026 | ||
| Other cheeses (grated, powdered, melted, etc.) | 2,1 | 2,0 | 1,8 | 3,5 | 2,6 | 2,9 | +11,4% | Sep 2026 | ||
|
WMP (Whole milk powder)
|
29,7 | 31,5 | 25,8 | 28,0 | 25,9 | 23,7 | -8,3% | Sep 2026 | ||
|
SMP (Skimmed milk powder)
|
8,7 | 5,9 | 4,2 | 5,3 | 4,4 | 4,5 | +1,6% | Sep 2026 | ||
| Cream | 2,4 | 1,5 | 2,0 | 3,5 | 2,5 | 3,1 | +24,6% | Sep 2026 | ||
| Dulce de leche | 5,9 | 5,3 | 5,4 | 4,5 | 5,0 | 5,4 | +8,9% | Sep 2026 | ||
| Milk chocolate (Mil Lt) | 8,4 | 3,8 | 3,7 | 5,1 | 3,1 | 2,5 | -20,2% | Sep 2026 | ||
| Dairy desserts and custards | 0,6 | 1,9 | 0,5 | 0,1 | 0,6 | 0,6 | -11,9% | Sep 2026 | ||
| Yogurt | 8,6 | 13,3 | 9,8 | 3,1 | 6,5 | 7,6 | +17,8% | Sep 2026 | ||
| DOMESTIC CONSUMPTION (Source: FAS-USDA) | 2022 | 2023 | 2024 | 2025 | 2025 | 2026(f) | % | Period | ||
| Cheese | 435 | 440 | 403 | 436 | 436 | 470 | +7,8% | Jan-Dec 2026 | Butter | 11 | 13 | 14 | 17 | 17 | 18 | +5,9% | Jan-Dec 2026 | SMP | 26 | 25 | 19 | 19 | 19 | 20 | +5,3% | Jan-Dec 2026 | WMP | 70 | 75 | 58 | 60 | 60 | 63 | +5,0% | Jan-Dec 2026 |
| PER CAPITA CONSUMPTIONS (kg) | 2022 | 2023 | 2024 | 2025 | 2025 | 2026(f) | % | Period | ||
| Cheese | 9,58 | 9,66 | 8,82 | 9,51 | ||||||
| Butter | 0,24 | 0,29 | 0,31 | 0,37 | ||||||
| SMP | 0,57 | 0,55 | 0,42 | 0,41 | ||||||
| WMP | 1,54 | 1,65 | 1,27 | 1,31 | ||||||
| % Self-sufficiency | 116,6% | 114,7% | 119,3% | 120,0% | ||||||
| SOCIO-ECONOMIC INDICATORS | 2022 | 2023 | 2024 | 2025 | 2025 | 2026(f) | % | Period | ||
| Population ('000) | 45.408 | 45.538 | 45.696 | 45.851 | ||||||
| GDP per capita (U.S. dollars) | 13.676 (e) | 13.836 (e) | 13.415 (e) | 14.362 (e) | ||||||
| GDP per capita (€) * | 12.987(e) | 12.796(e) | 12.390(e) | 12.710(e) | ||||||
(e): estimated
* Per capita GDP in Euro is calculated by using the yearly average exchange rate
(p): partial data
(f): forecast
NOTE:Per capita consumptions are obtained dividing total consumption (Source FAS-USDA ) by the population (Source FAO)
Source:
Raw milk area: Subsecretaría de Lechería - Ministerio de Agroindustria; Number of cows: FAO, National Animal Health and Agrifood Quality Service (SENASA);
Dairy production: Subsecretaría de Lechería - Ministerio de Agroindustria, from 2015 data is collected by a panel of dairies according to "Relevamiento Coyuntural de la Resolución 230/16" and historical information of the "Resolución 7/14".
Export and Import: IHS
Consumption: FAS-USDA
GDP per capita: International Monetary Found
Population: FAO
Note: Self-sufficiency rate = Milk deliveries/(Domestic use in milk equivalent ME)
Domestic use in milk equivalent (ME) = Milk deliveries + Import in ME - Export in ME
Last update: 2026-11-06
* Per capita GDP in Euro is calculated by using the yearly average exchange rate
(p): partial data
(f): forecast
NOTE:Per capita consumptions are obtained dividing total consumption (Source FAS-USDA ) by the population (Source FAO)
Source:
Raw milk area: Subsecretaría de Lechería - Ministerio de Agroindustria; Number of cows: FAO, National Animal Health and Agrifood Quality Service (SENASA);
Dairy production: Subsecretaría de Lechería - Ministerio de Agroindustria, from 2015 data is collected by a panel of dairies according to "Relevamiento Coyuntural de la Resolución 230/16" and historical information of the "Resolución 7/14".
Export and Import: IHS
Consumption: FAS-USDA
GDP per capita: International Monetary Found
Population: FAO
Note: Self-sufficiency rate = Milk deliveries/(Domestic use in milk equivalent ME)
Domestic use in milk equivalent (ME) = Milk deliveries + Import in ME - Export in ME
Last update: 2026-11-06
Due to extraordinary maintenance, some site features may be temporarily unavailable. Thank you for your understanding.