


























































































































A new Flash Bulletin will be available soon...
Register with CLAL.it to be the first to know when a new Flash Bulletin is available.
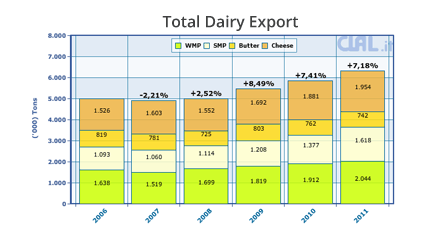
Sign up »CLAL.it outlines the import and export trade flows of Cheese, Butter and AMF, Milk Powders, Whey and WPC, Condensed Milk, Packed and Bulk Milk, Lactose, Casein and Caseinates by the main international players.
 enter
CLAL.it provides with some training paths, updated in real-time and useful to market analysis during workshops and project works.
 enter
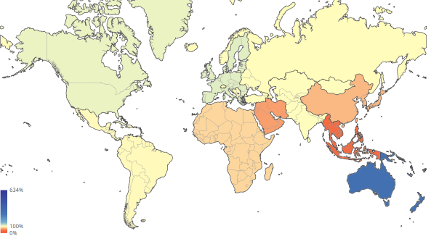
CLAL.it provides with a snapshot of the Milk production and livestock (cow, buffalo, goat, sheep, camel) and a number of interactive maps that visualize Milk Self-sufficiency worldwide.
 enter
 subscribe
CLAL News is an information service on the national and international dairy market, developed by the CLAL Team and Leo Bertozzi.
The information is addressed to all operators in the sector and concerns the market, product innovation, the strategies of the major companies and retailers.
On the right you can find the latest news in English language.
CLAL News is mobile-friendly: use the QR code to access from your smartphone

By Mirco De Vincenzi How much milk does Italy produce compared to its domestic requirements? This is a recurring question in the dairy ... read
By Mirco De Vincenzi Are declining milk profitability and reduced forage availability following the exceptionally hot summer of 2026 ... read
By Mirco De Vincenzi The analysis of the milk quality premium in Lombardy, carried out by applying the regional milk quality payment ... read
By Mirco De Vincenzi While milk protein prices are rising worldwide, declining milk fat prices are supporting EU exports of butter ... read
Explore the presentations by Alberto Lancellotti of the CLAL Team to learn about developments in inflation, energy, raw materials and climate.
This type of analysis is part of the services that CLAL generally provides to its Supporters.
To access the page, simply log in.



China: recovery after lockdown and trade agreements with the U.S.
This edition of CLAL Lens aims to quantify:
The information is reported both in terms of volumes and value, with real-time updates.
Check out the China imports with breakdown by dairy product >

Flash Bulletins on the Dairy Market
Reports on specific topics to find engaging answers to market questions
Flash Bulletins on the Dairy Market
Reports on specific topics to find engaging answers to market questions.
 17/04/2025
 17/09/2024
 09/07/2024
 20/02/2024
 November 30, 2018
 August 31, 2018
A new Flash Bulletin will be available soon...
Register with CLAL.it to be the first to know when a new Flash Bulletin is available.
Sign up »| US: Butter, Grade AA price | In aumento | +2,42% |
| US: Cheese 40# Blocks price | In calo | -3,40% |
| South America: Whole Milk Powder (WMP) price | In aumento | +2,50% |
| South America: Skim Milk Powder (SMP) price | In aumento | +1,22% |
| Oceania: Cheddar price | In calo | -1,78% |
| Oceania: Whole Milk Powder (WMP) price | In aumento | +2,52% |
| Western Europe: WMP price | In calo | -1,11% |
| Western Europe: Whey Powder Sweet price | In aumento | +1,05% |
| Western Europe: SMP price | In calo | -0,58% |
| Western Europe: Butter price (82%) | In calo | -2,63% |
| France: SMP price (Poudre 0%) | In aumento | +3,70% |
| France: Butter price (82%) | In aumento | +2,76% |
| IT, Parma: Parmig.Regg. (12 months) price | In aumento | +0,64% |
| IT, Parma: Parmig. PDO Regg. (18 months) price | In aumento | +0,58% |
| IT, Parma: Parmig. Regg. PDO (30 months) price | In aumento | +0,52% |
| IT, Parma: Parmig. Regg. PDO (15 months) price | In aumento | +0,64% |
| IT, Parma: Parmig.Regg. (24 months) price | In aumento | +0,54% |
| IT,Reggio Emilia: Parmig. Regg. (24 months) price | In aumento | +0,55% |

Click on a frame for more information and charts.
Show the data of:
Previous year
Current year
| Previous forecast
| Current forecast
Show the data of:
Previous year
Current year
| Previous forecast
| Current forecast
Show the data of:
Previous year
Current year
| Previous forecast
| Current forecast
Show the data of:
Previous year
Current year
| Previous forecast
| Current forecast
Show the data of:
Previous year
Current year
| Previous forecast
| Current forecast
| Milk - Balance sheet in Mio Tons | Year 2026 (Forecast made in July) | ||||||||
|---|---|---|---|---|---|---|---|---|
| Country |
Cow Milk Production 
|
Other Milk Production
|
Fluid Domestic Consumption
|
Factory Use
|
||||
| World | 573.13 | +1.4% | 124.63 | +2.2% | 197.75 | +1.0% | 495.30 | +1.8% |
| India | 105.40 | +2.1% | 116.00 | +2.4% | 93.00 | +2.2% | 128.37 | +2.3% |
| Share % | 18.4% | 93.1% | 47.0% | 25.9% | ||||
| EU-27 | 150.00 | +1.0% | 4.20 | -0.5% | 23.50 | +1.2% | 130.40 | +0.9% |
| Share % | 26.2% | 3.4% | 11.9% | 26.3% | ||||
| United States | 107.34 | +2.1% | 0.00 | 0.0% | 20.00 | -1.0% | 86.68 | +2.9% |
| Share % | 18.7% | 0.0% | 10.1% | 17.5% | ||||
| China | 40.90 | 0.0% | 0.91 | +1.1% | 15.63 | -0.2% | 26.79 | +0.1% |
| Share % | 7.1% | 0.7% | 7.9% | 5.4% | ||||
| Russia | 33.90 | -0.3% | 0.00 | 0.0% | 7.03 | -0.4% | 25.28 | 0.0% |
| Share % | 5.9% | 0.0% | 3.6% | 5.1% | ||||
| Source: USDA, Latest update: 2026-07-24 | ||||||||
| Milk - Balance sheet in Mio Tons | Year 2026 (Forecast made in January) | ||||||||
|---|---|---|---|---|---|---|---|---|
| Country | Cow Milk Production | Other Milk Production | Fluid Domestic Consumption | Factory Use | ||||
| World | 565.43 | +0.7% | 124.58 | +2.2% | 197.32 | +0.8% | 488.05 | +1.1% |
| India | 105.40 | +2.1% | 116.00 | +2.4% | 93.00 | +2.2% | 128.37 | +2.3% |
| Share % | 18.6% | 93.1% | 47.1% | 26.3% | ||||
| EU-27 | 144.80 | -0.5% | 4.15 | -0.5% | 23.00 | -0.9% | 125.68 | -0.3% |
| Share % | 25.6% | 3.3% | 11.7% | 25.8% | ||||
| United States | 106.19 | +1.2% | 0.00 | 0.0% | 20.00 | -1.0% | 85.55 | +1.7% |
| Share % | 18.8% | 0.0% | 10.1% | 17.5% | ||||
| China | 40.60 | 0.0% | 0.91 | +1.1% | 15.70 | +0.7% | 26.43 | -0.4% |
| Share % | 7.2% | 0.7% | 8.0% | 5.4% | ||||
| Russia | 33.90 | -0.3% | 0.00 | 0.0% | 7.03 | -0.4% | 25.28 | 0.0% |
| Share % | 6.0% | 0.0% | 3.6% | 5.2% | ||||
| Source: USDA, Latest update: 2026-07-24 | ||||||||
| Milk - Balance sheet in Mio Tons | Year 2025 | ||||||||
|---|---|---|---|---|---|---|---|---|
| Country | Cow Milk Production | Other Milk Production | Fluid Domestic Consumption | Factory Use | ||||
| World | 565.20 | +1.7% | 121.90 | +2.3% | 195.76 | +0.6% | 486.49 | +2.3% |
| India | 103.20 | +2.2% | 113.30 | +2.3% | 91.00 | +2.2% | 125.48 | +2.3% |
| Share % | 18.4% | 93.0% | 46.5% | 26.0% | ||||
| EU-27 | 148.50 | +1.3% | 4.22 | -1.3% | 23.21 | -1.3% | 129.21 | +1.7% |
| Share % | 26.5% | 3.5% | 11.9% | 26.8% | ||||
| United States | 105.08 | +2.6% | 0.00 | 0.0% | 20.20 | -1.0% | 84.25 | +3.5% |
| Share % | 18.7% | 0.0% | 10.3% | 17.5% | ||||
| China | 40.91 | +0.3% | 0.90 | +7.1% | 15.65 | -0.3% | 26.76 | +0.6% |
| Share % | 7.3% | 0.7% | 8.0% | 5.5% | ||||
| Russia | 34.00 | -0.2% | 0.00 | 0.0% | 7.05 | -0.4% | 25.28 | -0.2% |
| Share % | 6.1% | 0.0% | 3.6% | 5.2% | ||||
| Source: USDA, Latest update: 2026-07-24 | ||||||||
| Butter - Balance sheet in Mio Tons | Year 2026 (Forecast made in July) | ||||||||||||
|---|---|---|---|---|---|---|---|---|---|---|---|---|
| Country |
Beginning Stocks
|
Production
|
Import
|
Export
|
Consumption
|
Ending Stocks
|
||||||
| World | 0.25 | -6.7% | 12.76 | +3.0% | 0.70 | +7.9% | 1.26 | +4.5% | 12.21 | +3.1% | 0.24 | -6.0% |
| India | 0.00 | 0.0% | 7.44 | +3.4% | 0.00 | 0.0% | 0.05 | -30.8% | 7.39 | +3.7% | 0.00 | 0.0% |
| Share % | 0.0% | 58.3% | 0.0% | 4.0% | 60.5% | 0.0% | ||||||
| EU-27 | 0.00 | 0.0% | 2.20 | +2.3% | 0.09 | +12.5% | 0.33 | +20.4% | 1.97 | +0.3% | 0.00 | 0.0% |
| Share % | 0.0% | 17.2% | 12.9% | 26.2% | 16.1% | 0.0% | ||||||
| United States | 0.09 | -12.4% | 1.12 | +3.4% | 0.09 | +32.8% | 0.16 | +5.8% | 1.04 | +4.1% | 0.08 | -4.7% |
| Share % | 36.0% | 8.8% | 12.9% | 12.7% | 8.5% | 33.3% | ||||||
| New Zealand | 0.04 | -17.3% | 0.55 | +1.9% | 0.00 | 0.0% | 0.53 | +2.3% | 0.03 | 0.0% | 0.03 | -25.6% |
| Share % | 16.0% | 4.3% | 0.0% | 42.1% | 0.2% | 12.5% | ||||||
| Russia | 0.02 | 0.0% | 0.28 | -0.7% | 0.12 | +6.2% | 0.00 | 0.0% | 0.39 | +1.3% | 0.02 | 0.0% |
| Share % | 8.0% | 2.2% | 17.1% | 0.0% | 3.2% | 8.3% | ||||||
| Source: USDA, Latest update: 2026-07-24 | ||||||||||||
| Butter - Balance sheet in Mio Tons | Year 2026 (Forecast made in January) | ||||||||||||
|---|---|---|---|---|---|---|---|---|---|---|---|---|
| Country | Beginning Stocks | Production | Import | Export | Consumption | Ending Stocks | ||||||
| World | 0.25 | -6.3% | 12.62 | +2.4% | 0.67 | +1.8% | 1.12 | -4.8% | 12.19 | +3.1% | 0.24 | -4.0% |
| India | 0.00 | 0.0% | 7.44 | +3.4% | 0.00 | 0.0% | 0.09 | +3.7% | 7.35 | +3.4% | 0.00 | 0.0% |
| Share % | 0.0% | 59.0% | 0.0% | 8.0% | 60.3% | 0.0% | ||||||
| EU-27 | 0.00 | 0.0% | 2.06 | -1.4% | 0.08 | 0.0% | 0.23 | -15.1% | 1.91 | +0.5% | 0.00 | 0.0% |
| Share % | 0.0% | 16.3% | 11.9% | 20.5% | 15.7% | 0.0% | ||||||
| United States | 0.09 | -7.2% | 1.15 | +7.0% | 0.08 | +9.7% | 0.09 | -21.2% | 1.14 | +9.0% | 0.10 | +5.6% |
| Share % | 36.0% | 9.1% | 11.9% | 8.0% | 9.4% | 41.7% | ||||||
| New Zealand | 0.04 | -21.2% | 0.54 | 0.0% | 0.00 | 0.0% | 0.52 | 0.0% | 0.03 | 0.0% | 0.03 | -26.8% |
| Share % | 16.0% | 4.3% | 0.0% | 46.4% | 0.2% | 12.5% | ||||||
| Russia | 0.02 | 0.0% | 0.28 | -0.7% | 0.12 | +6.2% | 0.00 | 0.0% | 0.39 | +1.3% | 0.02 | 0.0% |
| Share % | 8.0% | 2.2% | 17.9% | 0.0% | 3.2% | 8.3% | ||||||
| Source: USDA, Latest update: 2026-07-24 | ||||||||||||
| Butter - Balance sheet in Mio Tons | Year 2025 | ||||||||||||
|---|---|---|---|---|---|---|---|---|---|---|---|---|
| Country | Beginning Stocks | Production | Import | Export | Consumption | Ending Stocks | ||||||
| World | 0.27 | +5.1% | 12.39 | +3.1% | 0.65 | +3.9% | 1.21 | +15.9% | 11.85 | +2.3% | 0.25 | -6.7% |
| India | 0.00 | 0.0% | 7.19 | +3.0% | 0.00 | +∞ | 0.07 | +1.6% | 7.13 | +3.0% | 0.00 | 0.0% |
| Share % | 0.0% | 58.4% | 0.0% | 6.0% | 60.3% | 0.0% | ||||||
| EU-27 | 0.00 | 0.0% | 2.15 | +1.8% | 0.08 | +95.1% | 0.27 | -0.7% | 1.96 | +4.2% | 0.00 | 0.0% |
| Share % | 0.0% | 17.4% | 12.1% | 23.0% | 16.6% | 0.0% | ||||||
| United States | 0.10 | +6.6% | 1.08 | +6.6% | 0.06 | -39.0% | 0.16 | +237.0% | 1.00 | -6.1% | 0.09 | -12.4% |
| Share % | 37.3% | 8.8% | 9.1% | 13.6% | 8.5% | 35.9% | ||||||
| New Zealand | 0.05 | +36.8% | 0.54 | +3.9% | 0.00 | 0.0% | 0.51 | +9.1% | 0.03 | 0.0% | 0.04 | -17.3% |
| Share % | 18.7% | 4.4% | 0.0% | 43.5% | 0.3% | 15.9% | ||||||
| Russia | 0.02 | +33.3% | 0.28 | -1.1% | 0.11 | +4.6% | 0.00 | -50.0% | 0.39 | +2.1% | 0.02 | 0.0% |
| Share % | 7.5% | 2.3% | 16.6% | 0.0% | 3.3% | 8.0% | ||||||
| Source: USDA, Latest update: 2026-07-24 | ||||||||||||
| Cheese - Balance sheet in Mio Tons | Year 2026 (Forecast made in July) | ||||||||||||
|---|---|---|---|---|---|---|---|---|---|---|---|---|
| Country |
Beginning Stocks
|
Production
|
Import
|
Export
|
Consumption
|
Ending Stocks
|
||||||
| World | 1.08 | +1.6% | 23.54 | +1.8% | 2.41 | +4.8% | 3.57 | +7.3% | 22.37 | +1.3% | 1.10 | +1.6% |
| EU-27 | 0.00 | 0.0% | 11.10 | +1.7% | 0.21 | +2.5% | 1.48 | +3.8% | 9.83 | +1.5% | 0.00 | 0.0% |
| Share % | 0.0% | 47.2% | 8.7% | 41.5% | 43.9% | 0.0% | ||||||
| United States | 0.63 | +1.8% | 6.82 | +1.5% | 0.15 | +5.8% | 0.75 | +22.5% | 6.21 | -0.2% | 0.62 | -0.5% |
| Share % | 58.3% | 29.0% | 6.2% | 21.0% | 27.8% | 56.4% | ||||||
| Russia | 0.04 | 0.0% | 1.16 | -0.4% | 0.33 | 0.0% | 0.03 | -6.7% | 1.46 | -0.2% | 0.04 | 0.0% |
| Share % | 3.7% | 4.9% | 13.7% | 0.8% | 6.5% | 3.6% | ||||||
| Brazil | 0.00 | 0.0% | 0.82 | +1.9% | 0.06 | +20.0% | 0.00 | 0.0% | 0.88 | +2.9% | 0.00 | 0.0% |
| Share % | 0.0% | 3.5% | 2.5% | 0.0% | 3.9% | 0.0% | ||||||
| Argentina | 0.06 | +16.0% | 0.58 | +7.4% | 0.00 | 0.0% | 0.11 | +12.2% | 0.47 | +7.8% | 0.06 | +3.4% |
| Share % | 5.6% | 2.5% | 0.0% | 3.1% | 2.1% | 5.5% | ||||||
| Source: USDA, Latest update: 2026-07-24 | ||||||||||||
| Cheese - Balance sheet in Mio Tons | Year 2026 (Forecast made in January) | ||||||||||||
|---|---|---|---|---|---|---|---|---|---|---|---|---|
| Country | Beginning Stocks | Production | Import | Export | Consumption | Ending Stocks | ||||||
| World | 1.07 | +0.9% | 23.19 | +1.3% | 2.28 | -1.3% | 3.32 | +1.4% | 22.15 | +1.1% | 1.07 | +0.1% |
| EU-27 | 0.00 | 0.0% | 10.81 | +0.2% | 0.19 | -5.0% | 1.37 | -1.1% | 9.63 | +0.3% | 0.00 | 0.0% |
| Share % | 0.0% | 46.6% | 8.3% | 41.3% | 43.5% | 0.0% | ||||||
| United States | 0.62 | +1.0% | 6.80 | +3.0% | 0.15 | +1.4% | 0.62 | +3.2% | 6.32 | +3.0% | 0.63 | +0.8% |
| Share % | 57.9% | 29.3% | 6.6% | 18.7% | 28.5% | 58.9% | ||||||
| Russia | 0.04 | 0.0% | 1.16 | -0.4% | 0.33 | 0.0% | 0.03 | -6.7% | 1.46 | -0.2% | 0.04 | 0.0% |
| Share % | 3.7% | 5.0% | 14.5% | 0.9% | 6.6% | 3.7% | ||||||
| Brazil | 0.00 | 0.0% | 0.82 | +1.9% | 0.05 | 0.0% | 0.00 | +33.3% | 0.87 | +1.6% | 0.00 | 0.0% |
| Share % | 0.0% | 3.5% | 2.2% | 0.0% | 3.9% | 0.0% | ||||||
| Argentina | 0.06 | +16.0% | 0.56 | +2.8% | 0.00 | 0.0% | 0.11 | +2.9% | 0.46 | +5.3% | 0.06 | -5.2% |
| Share % | 5.6% | 2.4% | 0.0% | 3.3% | 2.1% | 5.6% | ||||||
| Source: USDA, Latest update: 2026-07-24 | ||||||||||||
| Cheese - Balance sheet in Mio Tons | Year 2025 | ||||||||||||
|---|---|---|---|---|---|---|---|---|---|---|---|---|
| Country | Beginning Stocks | Production | Import | Export | Consumption | Ending Stocks | ||||||
| World | 1.06 | -2.6% | 23.12 | +2.1% | 2.30 | +3.3% | 3.33 | +6.4% | 22.08 | +1.4% | 1.08 | +1.6% |
| EU-27 | 0.00 | 0.0% | 10.91 | +1.0% | 0.20 | +7.0% | 1.42 | +2.5% | 9.69 | +0.9% | 0.00 | 0.0% |
| Share % | 0.0% | 47.7% | 8.6% | 43.4% | 44.2% | 0.0% | ||||||
| United States | 0.61 | -6.1% | 6.71 | +3.9% | 0.14 | -9.2% | 0.61 | +20.2% | 6.23 | +1.3% | 0.63 | +1.8% |
| Share % | 57.4% | 29.3% | 6.1% | 18.6% | 28.4% | 58.8% | ||||||
| Russia | 0.04 | 0.0% | 1.16 | 0.0% | 0.33 | +3.1% | 0.03 | -18.9% | 1.46 | +1.2% | 0.04 | 0.0% |
| Share % | 3.8% | 5.1% | 14.3% | 0.9% | 6.7% | 3.7% | ||||||
| Brazil | 0.00 | 0.0% | 0.81 | +3.2% | 0.05 | -20.6% | 0.00 | 0.0% | 0.85 | +1.4% | 0.00 | 0.0% |
| Share % | 0.0% | 3.5% | 2.2% | 0.0% | 3.9% | 0.0% | ||||||
| Argentina | 0.05 | -2.0% | 0.54 | +8.0% | 0.00 | +100.0% | 0.10 | -1.0% | 0.44 | +8.2% | 0.06 | +16.0% |
| Share % | 4.7% | 2.4% | 0.0% | 3.1% | 2.0% | 5.6% | ||||||
| Source: USDA, Latest update: 2026-07-24 | ||||||||||||
| SMP - Balance sheet in Mio Tons | Year 2026 (Forecast made in July) | ||||||||||||
|---|---|---|---|---|---|---|---|---|---|---|---|---|
| Country |
Beginning Stocks
|
Production
|
Import
|
Export
|
Consumption
|
Ending Stocks
|
||||||
| World | 0.44 | +15.6% | 4.92 | +1.0% | 1.38 | +1.5% | 2.41 | +1.8% | 3.87 | +1.7% | 0.47 | +5.6% |
| EU-27 | 0.00 | 0.0% | 1.48 | -3.3% | 0.05 | 0.0% | 0.84 | +5.5% | 0.69 | -12.1% | 0.00 | 0.0% |
| Share % | 0.0% | 30.1% | 3.6% | 34.9% | 17.8% | 0.0% | ||||||
| United States | 0.10 | +3.2% | 1.01 | +3.9% | 0.00 | 0.0% | 0.64 | -5.5% | 0.39 | +29.3% | 0.09 | -10.2% |
| Share % | 22.7% | 20.5% | 0.0% | 26.6% | 10.1% | 19.1% | ||||||
| India | 0.03 | +25.0% | 0.79 | +2.6% | 0.00 | 0.0% | 0.01 | +60.0% | 0.78 | +2.5% | 0.03 | +13.3% |
| Share % | 6.8% | 16.1% | 0.0% | 0.4% | 20.2% | 6.4% | ||||||
| New Zealand | 0.10 | +60.0% | 0.45 | 0.0% | 0.01 | 0.0% | 0.44 | +6.4% | 0.01 | 0.0% | 0.11 | +10.4% |
| Share % | 22.7% | 9.1% | 0.7% | 18.3% | 0.3% | 23.4% | ||||||
| Australia | 0.02 | -8.3% | 0.18 | +5.9% | 0.01 | 0.0% | 0.15 | -4.5% | 0.03 | 0.0% | 0.04 | +68.2% |
| Share % | 4.5% | 3.7% | 0.7% | 6.2% | 0.8% | 8.5% | ||||||
| Source: USDA, Latest update: 2026-07-24 | ||||||||||||
| SMP - Balance sheet in Mio Tons | Year 2026 (Forecast made in January) | ||||||||||||
|---|---|---|---|---|---|---|---|---|---|---|---|---|
| Country | Beginning Stocks | Production | Import | Export | Consumption | Ending Stocks | ||||||
| World | 0.43 | +11.7% | 4.85 | +1.4% | 1.37 | +1.5% | 2.32 | +0.3% | 3.90 | +3.2% | 0.44 | +1.9% |
| EU-27 | 0.00 | 0.0% | 1.43 | -0.7% | 0.04 | 0.0% | 0.75 | -1.3% | 0.72 | 0.0% | 0.00 | 0.0% |
| Share % | 0.0% | 29.5% | 2.9% | 32.3% | 18.5% | 0.0% | ||||||
| United States | 0.10 | 0.0% | 1.05 | +5.5% | 0.00 | 0.0% | 0.67 | -0.1% | 0.38 | +17.1% | 0.10 | 0.0% |
| Share % | 23.3% | 21.6% | 0.0% | 28.9% | 9.7% | 22.7% | ||||||
| India | 0.03 | +25.0% | 0.79 | +2.6% | 0.00 | 0.0% | 0.01 | +16.7% | 0.78 | +2.8% | 0.03 | +13.3% |
| Share % | 7.0% | 16.3% | 0.0% | 0.4% | 20.0% | 6.8% | ||||||
| New Zealand | 0.09 | +41.7% | 0.45 | -1.1% | 0.01 | 0.0% | 0.44 | +3.6% | 0.01 | 0.0% | 0.09 | +5.9% |
| Share % | 20.9% | 9.3% | 0.7% | 19.0% | 0.3% | 20.5% | ||||||
| Australia | 0.02 | 0.0% | 0.17 | 0.0% | 0.01 | 0.0% | 0.16 | 0.0% | 0.03 | 0.0% | 0.02 | 0.0% |
| Share % | 4.7% | 3.5% | 0.7% | 6.9% | 0.8% | 4.5% | ||||||
| Source: USDA, Latest update: 2026-07-24 | ||||||||||||
| SMP - Balance sheet in Mio Tons | Year 2025 | ||||||||||||
|---|---|---|---|---|---|---|---|---|---|---|---|---|
| Country | Beginning Stocks | Production | Import | Export | Consumption | Ending Stocks | ||||||
| World | 0.38 | +1.3% | 4.87 | +2.9% | 1.36 | -1.2% | 2.36 | +0.8% | 3.81 | +1.2% | 0.44 | +15.6% |
| EU-27 | 0.00 | 0.0% | 1.53 | +6.3% | 0.05 | +9.8% | 0.80 | +11.2% | 0.78 | +2.0% | 0.00 | 0.0% |
| Share % | 0.0% | 32.0% | 3.7% | 34.6% | 20.7% | 0.0% | ||||||
| United States | 0.10 | +4.4% | 0.98 | -5.4% | 0.00 | +100.0% | 0.68 | -9.3% | 0.30 | +5.3% | 0.10 | +3.2% |
| Share % | 26.0% | 20.5% | 0.0% | 29.4% | 7.9% | 23.3% | ||||||
| India | 0.02 | +20.0% | 0.77 | +2.0% | 0.00 | +∞ | 0.01 | -44.4% | 0.76 | +2.4% | 0.03 | +25.0% |
| Share % | 5.2% | 16.1% | 0.0% | 0.4% | 20.1% | 7.0% | ||||||
| New Zealand | 0.06 | -11.8% | 0.45 | +2.3% | 0.01 | +66.7% | 0.41 | -7.3% | 0.01 | 0.0% | 0.10 | +60.0% |
| Share % | 15.6% | 9.4% | 0.7% | 17.7% | 0.3% | 23.3% | ||||||
| Australia | 0.02 | -31.4% | 0.17 | -1.2% | 0.01 | -9.1% | 0.16 | -7.6% | 0.03 | +4.2% | 0.02 | -8.3% |
| Share % | 5.2% | 3.6% | 0.7% | 6.9% | 0.8% | 4.7% | ||||||
| Source: USDA, Latest update: 2026-07-24 | ||||||||||||
| WMP - Balance sheet in Mio Tons | Year 2026 (Forecast made in July) | ||||||||||||
|---|---|---|---|---|---|---|---|---|---|---|---|---|
| Country |
Beginning Stocks
|
Production
|
Import
|
Export
|
Consumption
|
Ending Stocks
|
||||||
| World | 0.57 | +10.1% | 4.41 | +0.2% | 1.06 | -0.9% | 2.03 | +8.5% | 3.53 | -0.6% | 0.48 | -14.8% |
| New Zealand | 0.33 | +30.0% | 1.43 | +0.7% | 0.00 | 0.0% | 1.50 | +13.0% | 0.02 | 0.0% | 0.24 | -26.8% |
| Share % | 57.9% | 32.4% | 0.0% | 73.9% | 0.6% | 50.0% | ||||||
| China | 0.13 | -10.3% | 1.14 | -1.3% | 0.42 | -2.6% | 0.04 | -29.8% | 1.50 | -2.2% | 0.14 | +7.7% |
| Share % | 22.8% | 25.9% | 39.6% | 2.0% | 42.5% | 29.2% | ||||||
| Brazil | 0.00 | 0.0% | 0.61 | +1.7% | 0.14 | +6.9% | 0.00 | 0.0% | 0.74 | +2.6% | 0.00 | 0.0% |
| Share % | 0.0% | 13.8% | 13.2% | 0.0% | 21.0% | 0.0% | ||||||
| EU-27 | 0.00 | 0.0% | 0.53 | -5.4% | 0.01 | -41.2% | 0.16 | -10.1% | 0.38 | -4.8% | 0.00 | 0.0% |
| Share % | 0.0% | 12.0% | 0.9% | 7.9% | 10.8% | 0.0% | ||||||
| Argentina | 0.03 | -29.5% | 0.22 | +12.8% | 0.00 | 0.0% | 0.17 | +14.9% | 0.06 | +5.0% | 0.02 | -41.9% |
| Share % | 5.3% | 5.0% | 0.0% | 8.4% | 1.7% | 4.2% | ||||||
| Source: USDA, Latest update: 2026-07-24 | ||||||||||||
| WMP - Balance sheet in Mio Tons | Year 2026 (Forecast made in January) | ||||||||||||
|---|---|---|---|---|---|---|---|---|---|---|---|---|
| Country | Beginning Stocks | Production | Import | Export | Consumption | Ending Stocks | ||||||
| World | 0.50 | -2.7% | 4.40 | -0.4% | 1.03 | +0.9% | 1.88 | -0.7% | 3.57 | +0.1% | 0.49 | -2.4% |
| New Zealand | 0.28 | +11.2% | 1.40 | -1.4% | 0.00 | 0.0% | 1.38 | 0.0% | 0.02 | 0.0% | 0.29 | +2.9% |
| Share % | 56.0% | 31.8% | 0.0% | 73.4% | 0.6% | 59.2% | ||||||
| China | 0.12 | -17.2% | 1.12 | -1.8% | 0.43 | 0.0% | 0.06 | 0.0% | 1.50 | -2.3% | 0.11 | -8.3% |
| Share % | 24.0% | 25.5% | 41.7% | 3.2% | 42.0% | 22.4% | ||||||
| Brazil | 0.00 | 0.0% | 0.61 | +1.7% | 0.14 | -1.5% | 0.00 | 0.0% | 0.74 | +1.1% | 0.00 | 0.0% |
| Share % | 0.0% | 13.9% | 13.6% | 0.0% | 20.7% | 0.0% | ||||||
| EU-27 | 0.00 | 0.0% | 0.59 | -1.7% | 0.02 | 0.0% | 0.16 | -8.8% | 0.45 | +1.1% | 0.00 | 0.0% |
| Share % | 0.0% | 13.4% | 1.9% | 8.5% | 12.6% | 0.0% | ||||||
| Argentina | 0.03 | -29.5% | 0.20 | +7.7% | 0.00 | 0.0% | 0.15 | +7.4% | 0.06 | +5.0% | 0.02 | -38.7% |
| Share % | 6.0% | 4.5% | 0.0% | 8.0% | 1.7% | 4.1% | ||||||
| Source: USDA, Latest update: 2026-07-24 | ||||||||||||
| WMP - Balance sheet in Mio Tons | Year 2025 | ||||||||||||
|---|---|---|---|---|---|---|---|---|---|---|---|---|
| Country | Beginning Stocks | Production | Import | Export | Consumption | Ending Stocks | ||||||
| World | 0.51 | -3.9% | 4.40 | -0.3% | 1.07 | +4.5% | 1.87 | +0.3% | 3.55 | -1.2% | 0.57 | +10.1% |
| New Zealand | 0.25 | +13.6% | 1.42 | 0.0% | 0.00 | 0.0% | 1.33 | -3.3% | 0.02 | 0.0% | 0.33 | +30.0% |
| Share % | 48.6% | 32.1% | 0.0% | 70.1% | 0.6% | 66.0% | ||||||
| China | 0.15 | -17.1% | 1.15 | -1.7% | 0.43 | +4.2% | 0.06 | +171.4% | 1.53 | -3.4% | 0.13 | -10.3% |
| Share % | 29.2% | 26.0% | 42.0% | 3.2% | 43.0% | 26.0% | ||||||
| Brazil | 0.00 | 0.0% | 0.60 | +1.7% | 0.13 | -10.9% | 0.00 | -66.7% | 0.73 | -0.5% | 0.00 | 0.0% |
| Share % | 0.0% | 13.6% | 12.7% | 0.0% | 20.5% | 0.0% | ||||||
| EU-27 | 0.00 | 0.0% | 0.56 | -8.6% | 0.02 | +13.3% | 0.18 | -14.8% | 0.40 | -4.8% | 0.00 | 0.0% |
| Share % | 0.0% | 12.7% | 2.0% | 9.5% | 11.2% | 0.0% | ||||||
| Argentina | 0.04 | -12.0% | 0.20 | +12.7% | 0.00 | 0.0% | 0.15 | +22.3% | 0.06 | +3.4% | 0.03 | -29.5% |
| Share % | 7.8% | 4.5% | 0.0% | 7.9% | 1.7% | 6.0% | ||||||
| Source: USDA, Latest update: 2026-07-24 | ||||||||||||
MILK EQUIVALENT | SMP | WMP | BUTTER | CHEESE
|
Milk Equivalent ('000 Ton) |
Δ Milk P. | Δ Imp* | Δ Exp* | Δ Cons* (e) |
Balance Δ(P+I-E-C) |
|||
| Main Players, changes Jan-Sep 2026 on Jan-Sep 2025 | ||||||||
| EU-27 |
+2,7%
+3.043
|
-2,3%
-57
|
+9,9%
+1.753
|
+0,2%
+200
|
+1.034 | |||
| New Zealand |
+4,2%
+553
|
-21,9%
-29
|
+9,0%
+1.170
|
0%
0
|
-647 | |||
| USA |
+2,6%
+2.083
|
+1,8%
+28
|
+5,4%
+522
|
+3,6%
+2.523
|
-934 | |||
| United Kingdom |
-0,3%
-35
|
+4,8%
+177
|
+8,2%
+225
|
+0,4%
+51
|
-134 | |||
| Australia |
+3,5%
+209
|
+1,2%
+13
|
-8,8%
-235
|
+0,4%
+21
|
+437 | |||
| Argentina |
+4,1%
+349
|
+31,0%
+5
|
+16,1%
+208
|
+5,2%
+221
|
-74 | |||
| Uruguay |
+8,5%
+137
|
+3,4%
+1
|
+6,1%
+72
|
0%
0
|
+67 | |||
| Chile |
+4,0%
+67
|
+7,5%
+36
|
+5,6%
+16
|
+2,1%
+6
|
+81 | |||
| TOTAL |
+2,7%
+6.407
|
+1,9%
+175
|
+7,7%
+3.731
|
+1,5%
+3.021
|
-170 | |||
|
Last update: 2026-11-18 (e) Estimated data * Import, Export and Consumption data are in Milk Equivalent (ME), comprehensive of WMP, Cheese, SMP+Butter and Liquid Milk. Import and Export data are also comprehensive of Condensed Milk and Yogurt.
Information Note
SOURCE
|
||||||||
| « Last year Current year » | ||||||||
|
Milk Equivalent ('000 Ton) |
Δ Milk P. | Δ Imp* | Δ Exp* | Δ Cons* (e) |
Balance Δ(P+I-E-C) |
|||
| Main Players, changes Jan-Dec 2025 on Jan-Dec 2024 | ||||||||
| EU-27 |
+1,8%
+2.605
|
+7,6%
+233
|
+3,7%
+851
|
+3,4%
+4.694
|
-2.707 | |||
| New Zealand |
+1,8%
+398
|
+35,6%
+48
|
-2,0%
-383
|
0%
0
|
+829 | |||
| USA |
+2,6%
+2.617
|
-4,4%
-95
|
+2,2%
+276
|
-0,9%
-830
|
+3.076 | |||
| United Kingdom |
+4,9%
+760
|
+4,1%
+193
|
+14,8%
+474
|
+1,2%
+200
|
+279 | |||
| Australia |
-0,5%
-45
|
+7,5%
+99
|
-3,5%
-138
|
+0,7%
+45
|
+147 | |||
| Argentina |
+9,7%
+1.059
|
+65,0%
+9
|
+13,4%
+232
|
+7,7%
+400
|
+436 | |||
| Uruguay |
+8,3%
+176
|
+4,6%
+2
|
+5,4%
+86
|
0%
0
|
+92 | |||
| Chile |
+6,2%
+143
|
-6,9%
-48
|
+47,5%
+137
|
-9,6%
-39
|
-3 | |||
| TOTAL |
+2,5%
+7.713
|
+3,6%
+439
|
+2,3%
+1.533
|
+1,7%
+4.470
|
+2.148 | |||
|
Last update: 2026-11-18 (e) Estimated data * Import, Export and Consumption data are in Milk Equivalent (ME), comprehensive of WMP, Cheese, SMP+Butter and Liquid Milk. Import and Export data are also comprehensive of Condensed Milk and Yogurt.
Information Note
SOURCE
|
||||||||
| « Last year Current year » | ||||||||
|
SMP ('000 Tons) |
Δ Prod | Δ Imp* | Δ Exp* | Δ Cons* (e) |
Balance Δ(P+I-E-C) |
|||
| Main Players, changes Jan-Mar 2026 on Jan-Mar 2025 | ||||||||
| EU-27 |
+18,1%
+55
|
+19,2%
+2
|
+9,6%
+18
|
0%
0
|
+39 | |||
| USA |
+6,6%
+17
|
+71,9%
+1
|
+5,0%
+8
|
+17,1%
+14
|
-5 | |||
| New Zealand |
-8,2%
-13
|
-97,8%
-1
|
-7,1%
-10
|
0%
0
|
-3 | |||
| Australia |
+6,6%
+2
|
-11,8%
-0
|
+3,3%
+1
|
0%
0
|
+1 | |||
| TOTAL |
+8,2%
+61
|
+7,9%
+1
|
+3,2%
+17
|
+5,5%
+14
|
+31 | |||
|
Last update: 2026-09-16 (e) Estimated data
Information Note
SOURCE
|
||||||||
| « Last year Current year » | ||||||||
|
SMP ('000 Tons) |
Δ Prod | Δ Imp* | Δ Exp* | Δ Cons* (e) |
Balance Δ(P+I-E-C) |
|||
| Main Players, changes Jan-Dec 2025 on Jan-Dec 2024 | ||||||||
| EU-27 |
+5,6%
+65
|
+10,8%
+4
|
+11,1%
+79
|
-1,2%
-8
|
-2 | |||
| USA |
-4,1%
-42
|
+411,4%
+3
|
-9,3%
-69
|
-14,8%
-57
|
+87 | |||
| New Zealand |
+1,4%
+6
|
+93,8%
+3
|
-7,4%
-33
|
0%
0
|
+42 | |||
| Australia |
+0,2%
+0
|
-12,4%
-1
|
-7,3%
-12
|
+4,2%
+1
|
+10 | |||
| TOTAL |
+1,1%
+30
|
+15,5%
+9
|
-1,7%
-35
|
-5,9%
-64
|
+137 | |||
|
Last update: 2026-09-16 (e) Estimated data
Information Note
SOURCE
|
||||||||
| « Last year Current year » | ||||||||
|
WMP ('000 Tons) |
Δ Prod | Δ Imp* | Δ Exp* | Δ Cons* (e) |
Balance Δ(P+I-E-C) |
|||
| Main Players, changes Jan-Mar 2026 on Jan-Mar 2025 | ||||||||
| New Zealand |
+4,7%
+20
|
+185,2%
+0
|
+6,2%
+25
|
0%
0
|
-5 | |||
| EU-27 |
-3,1%
-4
|
-61,0%
-4
|
-9,4%
-4
|
+1,1%
+1
|
-5 | |||
| USA |
-13,1%
-2
|
-23,3%
-1
|
+65,3%
+4
|
+20,0%
+2
|
-10 | |||
| Australia |
-22,2%
-1
|
+3,7%
+0
|
-40,2%
-5
|
0%
0
|
+5 | |||
| TOTAL |
+2,0%
+12
|
-22,4%
-5
|
+4,1%
+19
|
+2,4%
+3
|
-15 | |||
|
Last update: 2026-09-16 (e) Estimated data
Information Note
SOURCE
|
||||||||
| « Last year Current year » | ||||||||
|
WMP ('000 Tons) |
Δ Prod | Δ Imp* | Δ Exp* | Δ Cons* (e) |
Balance Δ(P+I-E-C) |
|||
| Main Players, changes Jan-Dec 2025 on Jan-Dec 2024 | ||||||||
| New Zealand |
0,0%
-0
|
+7,5%
+0
|
-3,3%
-45
|
0%
0
|
+45 | |||
| EU-27 |
-5,2%
-32
|
+18,3%
+3
|
-15,0%
-31
|
-0,6%
-3
|
+5 | |||
| USA |
+15,6%
+8
|
+18,5%
+3
|
+55,7%
+14
|
0%
0
|
-3 | |||
| Australia |
-5,0%
-1
|
+2,3%
+1
|
-9,0%
-5
|
0%
0
|
+5 | |||
| TOTAL |
-1,2%
-25
|
+9,9%
+7
|
-4,1%
-67
|
-0,5%
-3
|
+52 | |||
|
Last update: 2026-09-16 (e) Estimated data
Information Note
SOURCE
|
||||||||
| « Last year Current year » | ||||||||
|
BURRO ('000 Tons) |
Δ Prod | Δ Imp* | Δ Exp* | Δ Cons* (e) |
Balance Δ(P+I-E-C) |
|||
| Main Players, changes Jan-Aug 2025 on Jan-Aug 2024 | ||||||||
| New Zealand |
+17,6%
+58
|
+131,6%
+0
|
+13,2%
+36
|
0%
0
|
+22 | |||
| EU-27 |
+5,0%
+67
|
+129,8%
+31
|
-3,4%
-6
|
+8,8%
+109
|
-5 | |||
| USA |
+6,4%
+44
|
-23,8%
-16
|
+155,9%
+44
|
-2,4%
-17
|
+1 | |||
| United Kingdom |
+9,0%
+0
|
+0,1%
+0
|
+12,9%
+4
|
-1,0%
-1
|
-2 | |||
| Australia |
+17,3%
+3
|
-0,7%
-0
|
-20,7%
-3
|
+3,1%
+1
|
+5 | |||
| TOTAL |
+7,2%
+172
|
+9,5%
+15
|
+14,3%
+75
|
+4,3%
+92
|
+21 | |||
|
Last update: 2026-02-08 (e) Estimated data
Information Note
SOURCE
|
||||||||
| « Last year Current year » | ||||||||
|
BURRO ('000 Tons) |
Δ Prod | Δ Imp* | Δ Exp* | Δ Cons* (e) |
Balance Δ(P+I-E-C) |
|||
| Main Players, changes Jan-Dec 2024 on Jan-Dec 2023 | ||||||||
| New Zealand |
+0,9%
+5
|
+15,2%
+0
|
-9,1%
-43
|
0%
0
|
+48 | |||
| EU-27 |
-6,7%
-142
|
-18,9%
-10
|
-4,8%
-14
|
-1,4%
-26
|
-112 | |||
| USA |
+5,9%
+56
|
+34,3%
+28
|
+29,4%
+11
|
+6,3%
+63
|
+11 | |||
| United Kingdom |
-6,8%
-0
|
+9,7%
+6
|
-19,5%
-11
|
-1,0%
-2
|
+18 | |||
| Australia |
+7,9%
+3
|
-11,7%
-6
|
+136,8%
+13
|
+1,6%
+1
|
-17 | |||
| TOTAL |
-2,2%
-78
|
+7,4%
+18
|
-5,1%
-44
|
+1,1%
+36
|
-53 | |||
|
Last update: 2026-02-08 (e) Estimated data
Information Note
SOURCE
|
||||||||
| « Last year Current year » | ||||||||
|
FORMAGGIO ('000 Tons) |
Δ Prod | Δ Imp* | Δ Exp* | Δ Cons* (e) |
Balance Δ(P+I-E-C) |
|||
| Main Players, changes Jan-Aug 2025 on Jan-Aug 2024 | ||||||||
| EU-27 |
+0,9%
+60
|
+5,7%
+7
|
+0,4%
+3
|
+2,0%
+118
|
-54 | |||
| USA |
+2,7%
+119
|
-3,6%
-5
|
+15,3%
+54
|
-0,2%
-7
|
+67 | |||
| New Zealand |
+18,8%
+49
|
+13,3%
+1
|
+14,6%
+36
|
0%
0
|
+14 | |||
| United Kingdom |
+3,6%
+0
|
+3,4%
+10
|
-0,5%
-1
|
+2,5%
+13
|
-2 | |||
| Australia |
-0,8%
-2
|
+8,2%
+6
|
+2,4%
+3
|
+1,4%
+3
|
-2 | |||
| TOTAL |
+2,0%
+226
|
+2,9%
+19
|
+5,4%
+95
|
+1,2%
+127
|
+24 | |||
|
Last update: 2025-12-16 (e) Estimated data
Information Note
SOURCE
|
||||||||
| « Last year Current year » | ||||||||
|
FORMAGGIO ('000 Tons) |
Δ Prod | Δ Imp* | Δ Exp* | Δ Cons* (e) |
Balance Δ(P+I-E-C) |
|||
| Main Players, changes Jan-Dec 2024 on Jan-Dec 2023 | ||||||||
| EU-27 |
+2,4%
+230
|
+7,6%
+13
|
+0,1%
+1
|
+2,8%
+240
|
+2 | |||
| USA |
+0,6%
+37
|
+11,3%
+22
|
+18,0%
+79
|
+0,2%
+15
|
-35 | |||
| New Zealand |
+3,8%
+14
|
-33,1%
-5
|
+0,1%
+0
|
0%
0
|
+9 | |||
| United Kingdom |
-3,7%
-0
|
+3,9%
+17
|
+9,8%
+18
|
-2,9%
-22
|
+21 | |||
| Australia |
+0,3%
+1
|
-6,4%
-7
|
+28,8%
+37
|
+1,5%
+5
|
-48 | |||
| TOTAL |
+1,7%
+283
|
+4,4%
+40
|
+5,4%
+135
|
+1,5%
+238
|
-50 | |||
|
Last update: 2025-12-16 (e) Estimated data
Information Note
SOURCE
|
||||||||
| « Last year Current year » | ||||||||
 /Ton |
US (2026-11-20) |
OCEANIA (2026-11-20) |
EU¹ (2026-11-18) |
GDT² (2026-11-17) |
||||
| Product | Value | % Chg* | Value | % Chg* | Value | % Chg* | Value | % Chg* |
| CHEESE | 3.445 | -3,4% | 3.938 | -2,8% | 3.580 | -0,6% | 3.727 | -7,0% |
| BUTTER | 2.800 | +2,4% | 4.400 | -4,9% | 4.313 | -4,4% | 4.151 | -7,0% |
| SMP | 4.564 | -5,0% | 4.200 | +4,0% | 4.110 | -2,0% | 4.177 | +1,5% |
| WMP | 5.490 | +0,2% | 4.013 | +3,9% | 4.297 | -2,0% | 4.051 | +1,7% |
| WHEY POWDER | 1.753 | 0,0% | 2.291 | -1,5% | ||||
| MILK (US$/100Kg) | 42,99 | -1,5% | 42,74 | +0,2% | 50,54 | -1,5% | ||
|
*Change from previous price
¹ Prices refer to Germany. Cheese prices refer to Cheddar in the European Union (source: European Commission (Milk Market Observatory)) ² Contract 2 GDT n.a.: not available |
||||||||
 /Ton |
US (2026-11-20) |
OCEANIA (1795129200) |
EU¹ (2026-11-18) |
GDT² (2026-11-17) |
||||
| Product | Value | % Chg* | Value | % Chg* | Value | % Chg* | Value | % Chg* |
| CHEESE | 3.134 | -2,6% | 3.583 | -1,2% | 3.207 | -0,6% | 3.384 | -5,3% |
| BUTTER | 2.547 | +3,2% | 4.004 | -3,3% | 3.925 | -2,5% | 3.769 | -5,3% |
| SMP | 4.152 | -4,5% | 3.822 | +5,7% | 3.740 | 0,0% | 3.792 | +3,3% |
| WMP | 4.995 | +0,8% | 3.651 | +5,5% | 3.910 | 0,0% | 3.678 | +3,6% |
| WHEY POWDER | 1.595 | +0,6% | 2.085 | +0,5% | ||||
| MILK (€/100Kg) | 37,34 | -0,8% | 37,12 | +0,9% | 45,12 | +1,3% | ||
|
*Change from previous price
¹ Prices refer to Germany. Cheese prices refer to Cheddar in the European Union (source: European Commission (Milk Market Observatory)) ² Contract 2 GDT n.a.: not available |
||||||||
|
|||||||||||||||||||||||||||||||||||||||||||||||||||||||||||||||||||||||||||||||||||||||||||||||||||||||||||||||||||||||||||||||||||||||||||||||
|
Percentage price changes relate to (i) the last quotation period, and to (ii) the same period of the previous year
CLICK HERE for further information. |
|||||||||||||||||||||||||||||||||||||||||||||||||||||||||||||||||||||||||||||||||||||||||||||||||||||||||||||||||||||||||||||||||||||||||||||||
Grana Padano Stocks:
- Marked PDO: Oct 31, 2026 2.093.206 number of wheels (-0,3% on Sep 2026; +10,4% on Oct, 2025)
- Total: Oct 31, 2026 0 number of wheels (+nan% on Sep 2026; -100,0% on Oct, 2025)
CLAL is an Italian Dairy Economic Consulting firm that analyses the Dairy Market, describes trends and provides data, news and synthesis thanks to information and training activities.
The subscription to the newsletter is free and allows to receive timely updates via e-mail regarding: new web pages, news about the dairy market, fluctuations in the price and production of dairy products in Italy and Worldwide.
Sign up »
for the on-line services
offered by CLAL.it.
Clal.it outlines hereafter some important changes that occured in the market and may have an impact on the market trend:
Access the Dairy World Trade section » to analyse more in depth
* Compared to the same period of the previous year
Import or Export changes become “Alerts” if the given thresholds are exceeded: Cream ± 20 %, Milk in packings of > 2 l ± 20 %, Milk in packings of <= 2 l ± 20 %, Baby milk ± 15 %, Butter ± 15 %, Cheese ± 15 %, SMP ± 20 %, WMP ± 20 %, Whey powder ± 40 %
CLAL.it provides the Operators with a range of updated information.
subscribe
By Mirco De Vincenzi How much milk does Italy produce compared to its domestic requirements? This is a recurring question in the dairy ... read
By Mirco De Vincenzi Are declining milk profitability and reduced forage availability following the exceptionally hot summer of 2026 ... read
By Mirco De Vincenzi The analysis of the milk quality premium in Lombardy, carried out by applying the regional milk quality payment ... read
| Average price USD / Ton | Change | |
| AMF (Anhydrous Milk Fat) | 4.878 | -8,2 % |
| BMP (Butter Milk Powder) | 4.473 | -1,7 % |
| BUTTER 82% | 4.205 | -6,5 % |
| RENNET CASEIN | n.a. | - |
| CHEDDAR | 3.815 | -4,1 % |
| LACTOSE | 1.759 | +0,8 % |
| MOZZARELLA | 4.036 | -1,6 % |
| MPC (Milk Protein Concentrate) | n.a. | - |
| SMP (Skim. milk Powder) | 4.187 | +2,2 % |
| SWP (Sweet Whey Powder) | n.a. | - |
| WMP (Whole milk Powder) | 4.081 | +2,7 % |
| Next GlobalDairyTrade Event: December 01, 2026 | ||
| Exports of G.Padano + P.Reggiano: | +3,96 % |
| Exports of Gorgonzola: | -0,52 % |
| Exports of Grated cheese: | +5,65 % |
| Imports of Full-fat bulk milk: | -14,12 % |
| Imports of Packed semi-skimmed milk: | -15,79 % |
| Next Update: December 11, 2026 | |
 Performance and Competitiveness of Italian Dairy Farms

An innovative product that combines the fragrance of Grana Padano with a practical and hygienic rotating grater.
The grater contains Grana Padano PDO packaged in a protective atmosphere.
Easy to use: grate only the amount you want when you need and then put it back in the fridge without having to clean it.
Clal opens up a showcase for innovative technological products. Each product is linked with a technical sheet and a Company profile.
The Agricultural Market News are now available on TESEO.clal.it: click here.