Production of Mozzarella di Bufala Campana PDO, Italy
|
|
On this page, you will find the monthly data for Mozzarella di Bufala Campana PDO production.
|
| |
|
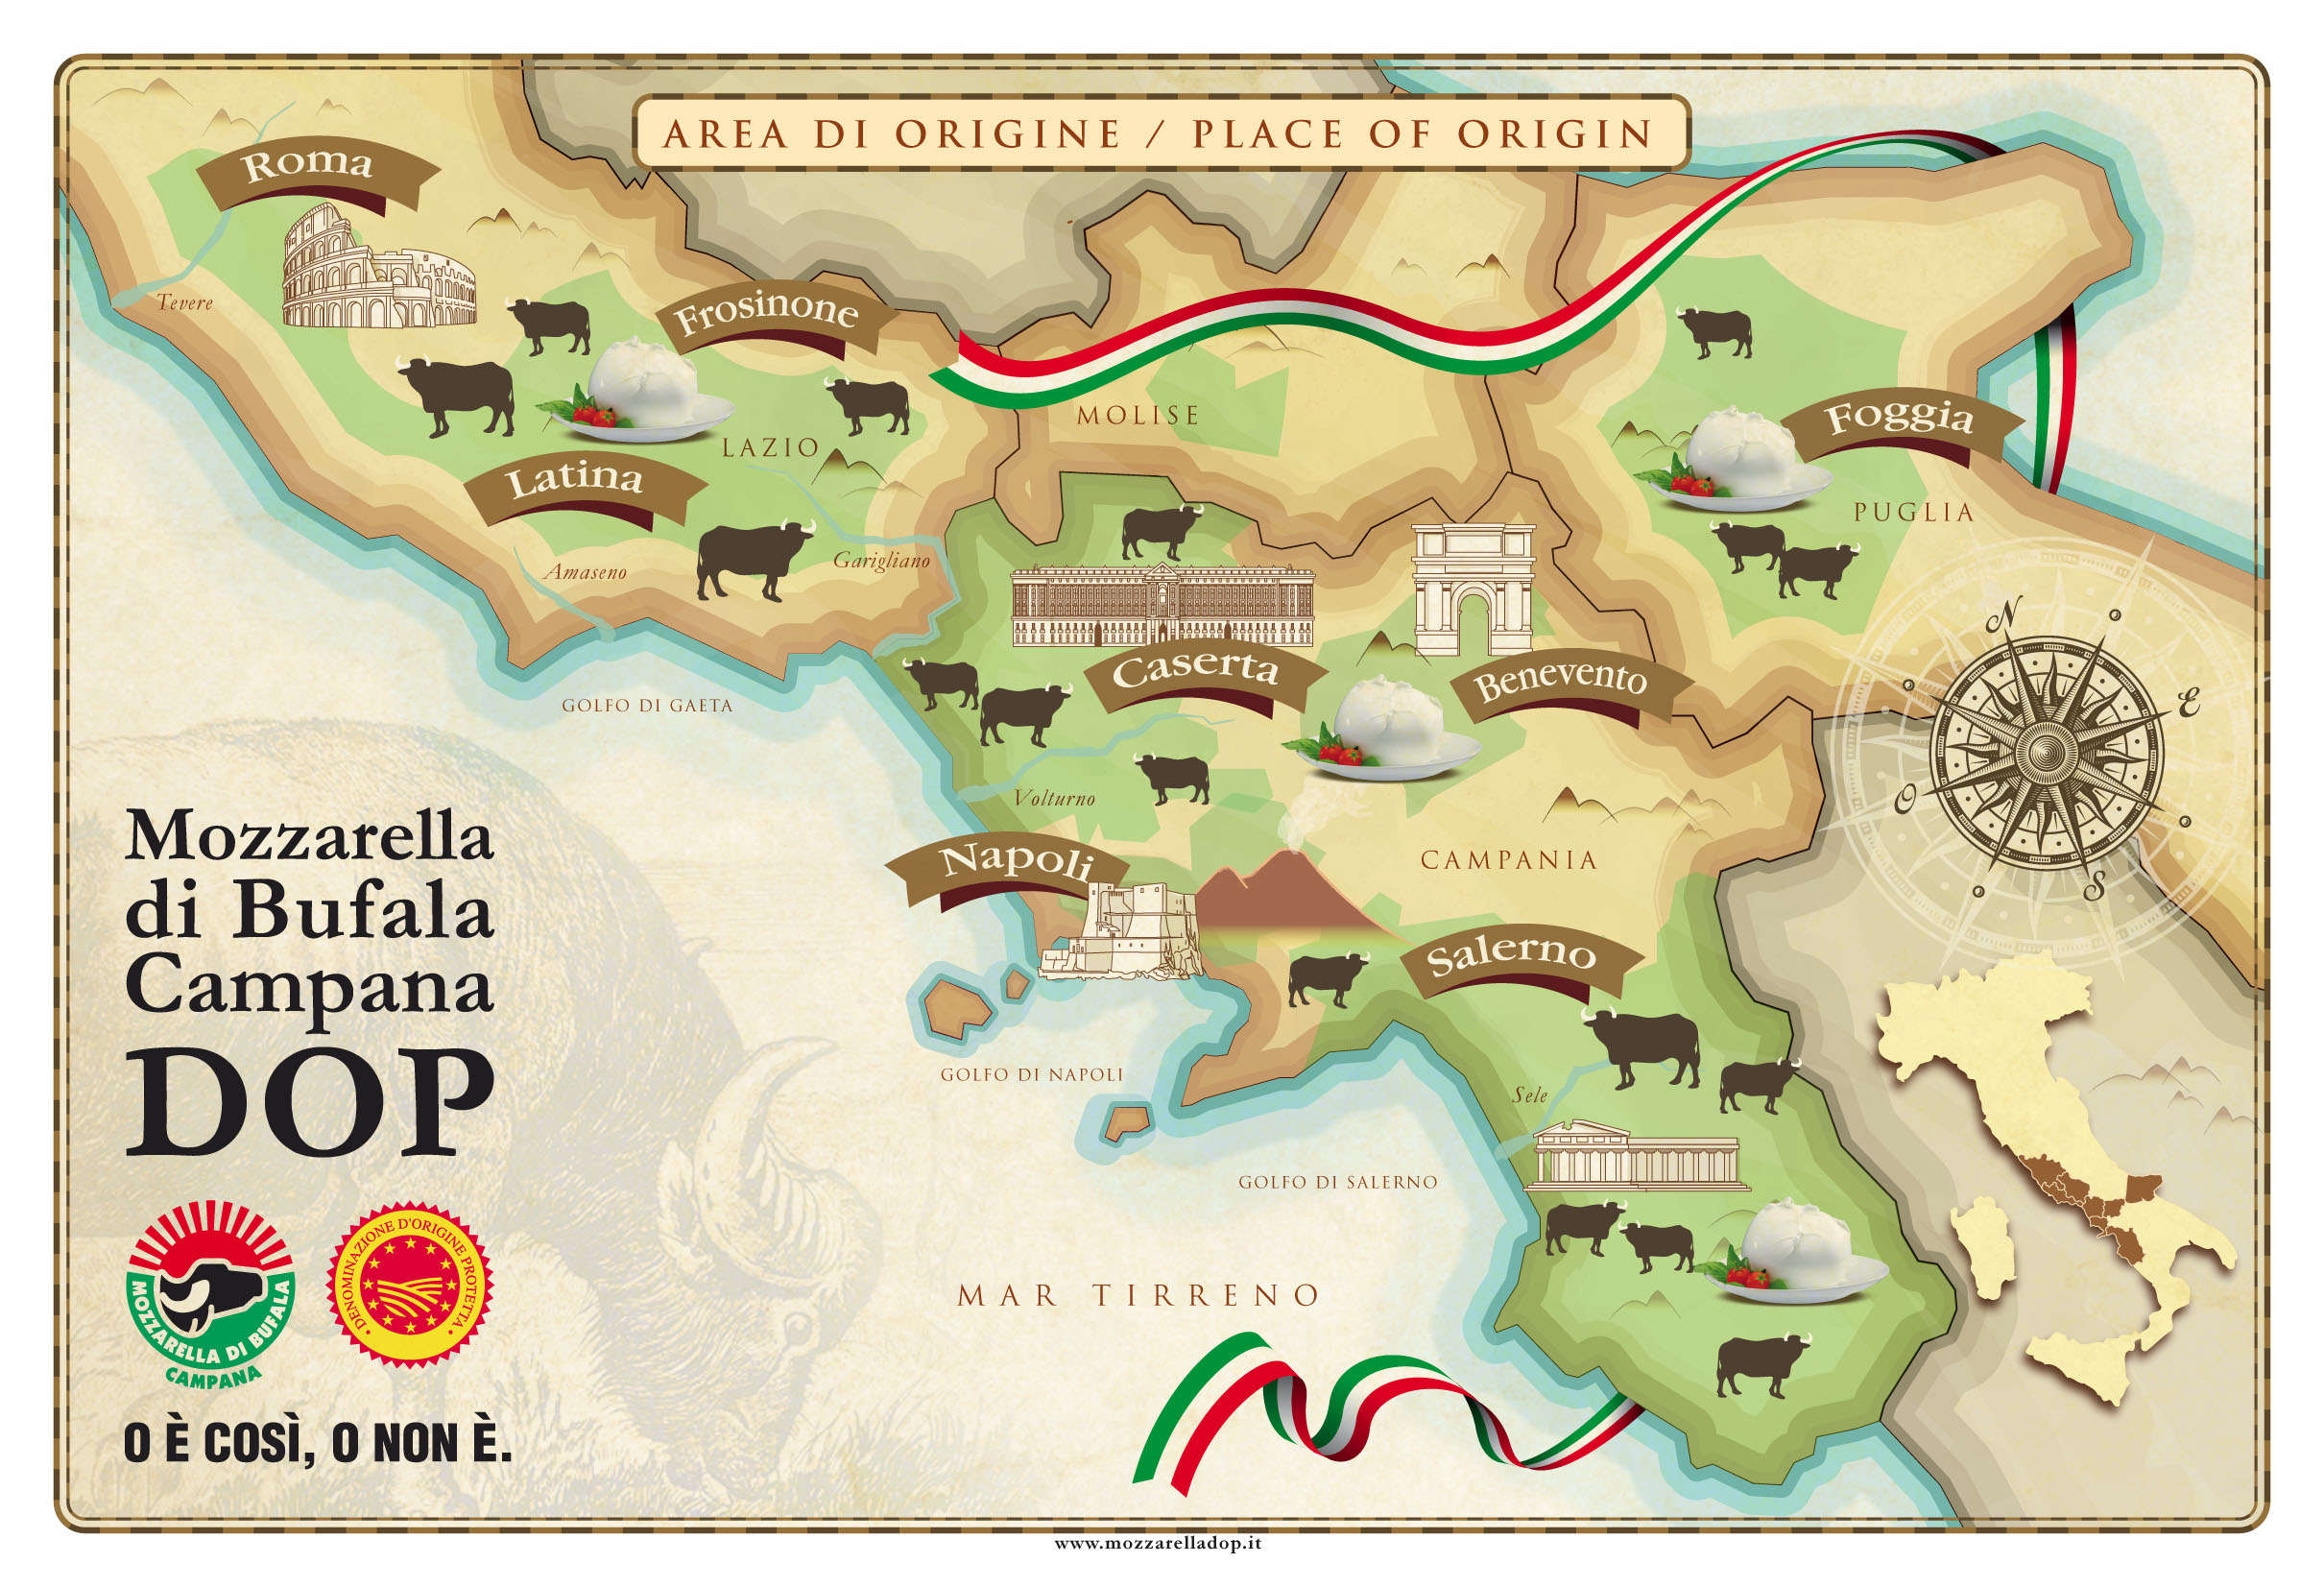
Mozzarella di Bufala Campana DOP forms part of the fresh, stringy paste cheeses produced exclusively with buffalo milk from the area of origin and created with a technological process that complies with the production regulations. With the inclusion in the EU register of Denomination of Protected Origin in 1996, the organoleptic and merchandise characteristics of the typical mozzarella of Campania buffalo milk was officially recognised on the basis of the environmental conditions and traditional working practices that exist in the specific and limited area of production.
Buffalo milk has a different composition to that of other animal species, such as cows and sheep, for example, whose milk is used for cheese production. It is richer in protein, fats and, above all, in overall calcium. These chemical characteristics allow those who work with it to obtain a cheese making yield that is double that normally obtained with cows' milk. Another particular characteristic is the absence of carotenoids in its makeup which means that the final product takes on the typical and unique porcelain white colour of the Mozzarella di Bufala Campana. The milk produced in the farms is rapidly transported to the production plants where it is subjected to hygiene-health checks and all the other checks required by the Regulations, before beginning the effective working of the product.
For more information about History and origins, Production process and Nutritional aspects, consult the official website of Consorzio di Tutela della Mozzarella di Bufala Campana DOP.
|
|
|
Production of Mozzarella di Bufala Campana PDO
Tons |
|
Month
|
2016 |
2021 |
2022 |
2023 |
2024 |
2025 |
2026 |
± % on
2025
|
± % on
2024
|
| January |
2.813 |
3.252 |
3.459 |
3.655 |
3.541 |
3.800 |
3.756 |
-1,2%
|
+6,1%
|
| February |
2.860 |
3.206 |
3.503 |
3.507 |
3.490 |
3.569 |
3.558 |
-0,3%
|
+1,9%
|
| March |
3.475 |
4.255 |
4.491 |
4.496 |
4.189 |
4.374 |
4.584 |
+4,8%
|
+9,4%
|
| April |
3.662 |
4.439 |
4.700 |
4.678 |
4.818 |
5.227 |
5.083 |
-2,8%
|
+5,5%
|
| May |
4.118 |
4.852 |
5.648 |
5.400 |
5.411 |
5.717 |
5.741 |
+0,4%
|
+6,1%
|
| June |
4.386 |
5.761 |
5.907 |
6.096 |
5.351 |
6.104 |
|
|
|
| July |
4.742 |
5.941 |
6.055 |
6.053 |
6.415 |
6.587 |
|
|
|
| August |
4.692 |
5.722 |
6.022 |
5.893 |
6.192 |
5.904 |
|
|
|
| September |
3.963 |
4.880 |
4.659 |
4.822 |
4.627 |
4.713 |
|
|
|
| October |
3.345 |
4.032 |
3.891 |
3.987 |
4.145 |
4.139 |
|
|
|
| November |
3.030 |
3.696 |
3.776 |
3.490 |
3.761 |
3.522 |
|
|
|
| December |
3.121 |
3.729 |
3.703 |
3.510 |
3.778 |
3.930 |
|
|
|
| Jan-May |
16.927 |
20.005 |
21.801 |
21.736 |
21.449 |
22.687 |
22.722 |
| % y-o-y ¹ |
-
|
+18,2%
|
+9,0%
|
-0,3%
|
-1,3%
|
+5,8%
|
+0,2%
|
| Total Year |
44.207 |
53.766 |
55.815 |
55.588 |
55.718 |
57.584 |
| % y-o-y ¹ |
-
|
+21,6%
|
+3,8% |
-0,4% |
+0,2% |
+3,4% |
|
Last Update: 26-06-2026 |
1) change from the same period of previous year , except for year
2021, where the change is from the same period 5 years ago
Source: DQA. Since 2026 Rina Agrifood SpA
|
Min Production in the last 5 years
Max Production in the last 5 years
|
|
|
|
Visit the page:
|
|
|
Due to extraordinary maintenance, some site features may be temporarily unavailable. Thank you for your understanding.


.jpg)


.jpg)


