


Performance of Dairy Farms FARM S/STEM
Il progetto S/STEMA STALLA ha
l'obiettivo di misurare la competitività delle Aziende agricole da latte bovino italiane.
Il Team di CLAL ha selezionato alcuni Allevatori del nord Italia
particolarmente attenti a performance e costi, e li ha incontrati presso le loro stalle per comprendere
il funzionamento e rilevare i dati dell'azienda agricola.
Il grafico a ragnatela "Performance" mette a confronto le prestazioni rilevate in tali Aziende.
È possibile confrontare la propria Stalla con quelle che partecipano al progetto
compilando il form sottostante il grafico.
Leggi di più riguardo
al progetto S/STEMA STALLA »
How to interpret the graph:
Ogni area colorata rappresenta una stalla, ed i vertici dell’area indicano sugli assi i risultati della stalla in:
produttività, grasso e proteine, anticipo del primo parto, capacità di rimonta e lattazioni in una carriera.
Questi sono punti fondamentali delle performance.
Per ognuno di questi assi un valore più alto corrisponde ad una prestazione migliore, quindi più è ampia l'area,
maggiori sono le performance. In cima abbiamo il numero di capi in lattazione.
Le stalle sono elencate sul lato destro dalla più grande alla più piccola, e sono selezionabili singolarmente così da
poterle confrontare a piacimento.
Spostando il mouse sul grafico si possono visualizzare i valori numerici.
Cliccando il bottone quadrato 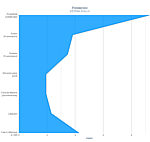 sotto al grafico
al centro della pagina, il grafico si apre per permettere uno studio più dettagliato
dei particolari. In questa modalità, è sufficiente selezionare un'area con il mouse per ottenere lo zoom.
sotto al grafico
al centro della pagina, il grafico si apre per permettere uno studio più dettagliato
dei particolari. In questa modalità, è sufficiente selezionare un'area con il mouse per ottenere lo zoom.


be it for the production of:
In the study sample there are Farms with a high replacement capacity. . These are Farms which are expanding and/or which depend for a considerable part of their returns on the sale of heifers.
Vedi i ricavi alla stalla rilevati dal progetto S/STEMA STALLA »
Your dairy Farm
Compilando il form sottostante è possibile visualizzare la tua Stalla nel grafico (area di colore rosso, contrassegnata con il codice TU__) e confrontarla con le Stalle che partecipano al progetto S/STEMA STALLA. L'animazione avviene sul tuo computer: nessun dato sarà inviato a CLAL. Tutti i dati devono essere medie annuali.
FARM S/STEM Performance
Minimum, average and maximum performance of dairy Farms participating in the project.
Leggi di più riguardo al progetto
S/STEMA STALLA »
Israel 2011: 24.4 months
Source: The Israeli Herdbook 2011
For any questions or comments please write to
